
This website plots data from three urban micrometeorological sites of SMEAR III station in Helsinki:
Kumpula (60 12' 10.14''N 24 57' 40.06''E). Measurement period 1 Dec 2005 onward.
Hotel Torni 1 (60 10' 04.09''N 24 56' 18.69''E). Measurement period 28 Sep 2010 onward.
Hotel Torni 2 (60 10' 04.05''N 24 56' 19.07''E). Measurement period 26 Jun 2013 onward.
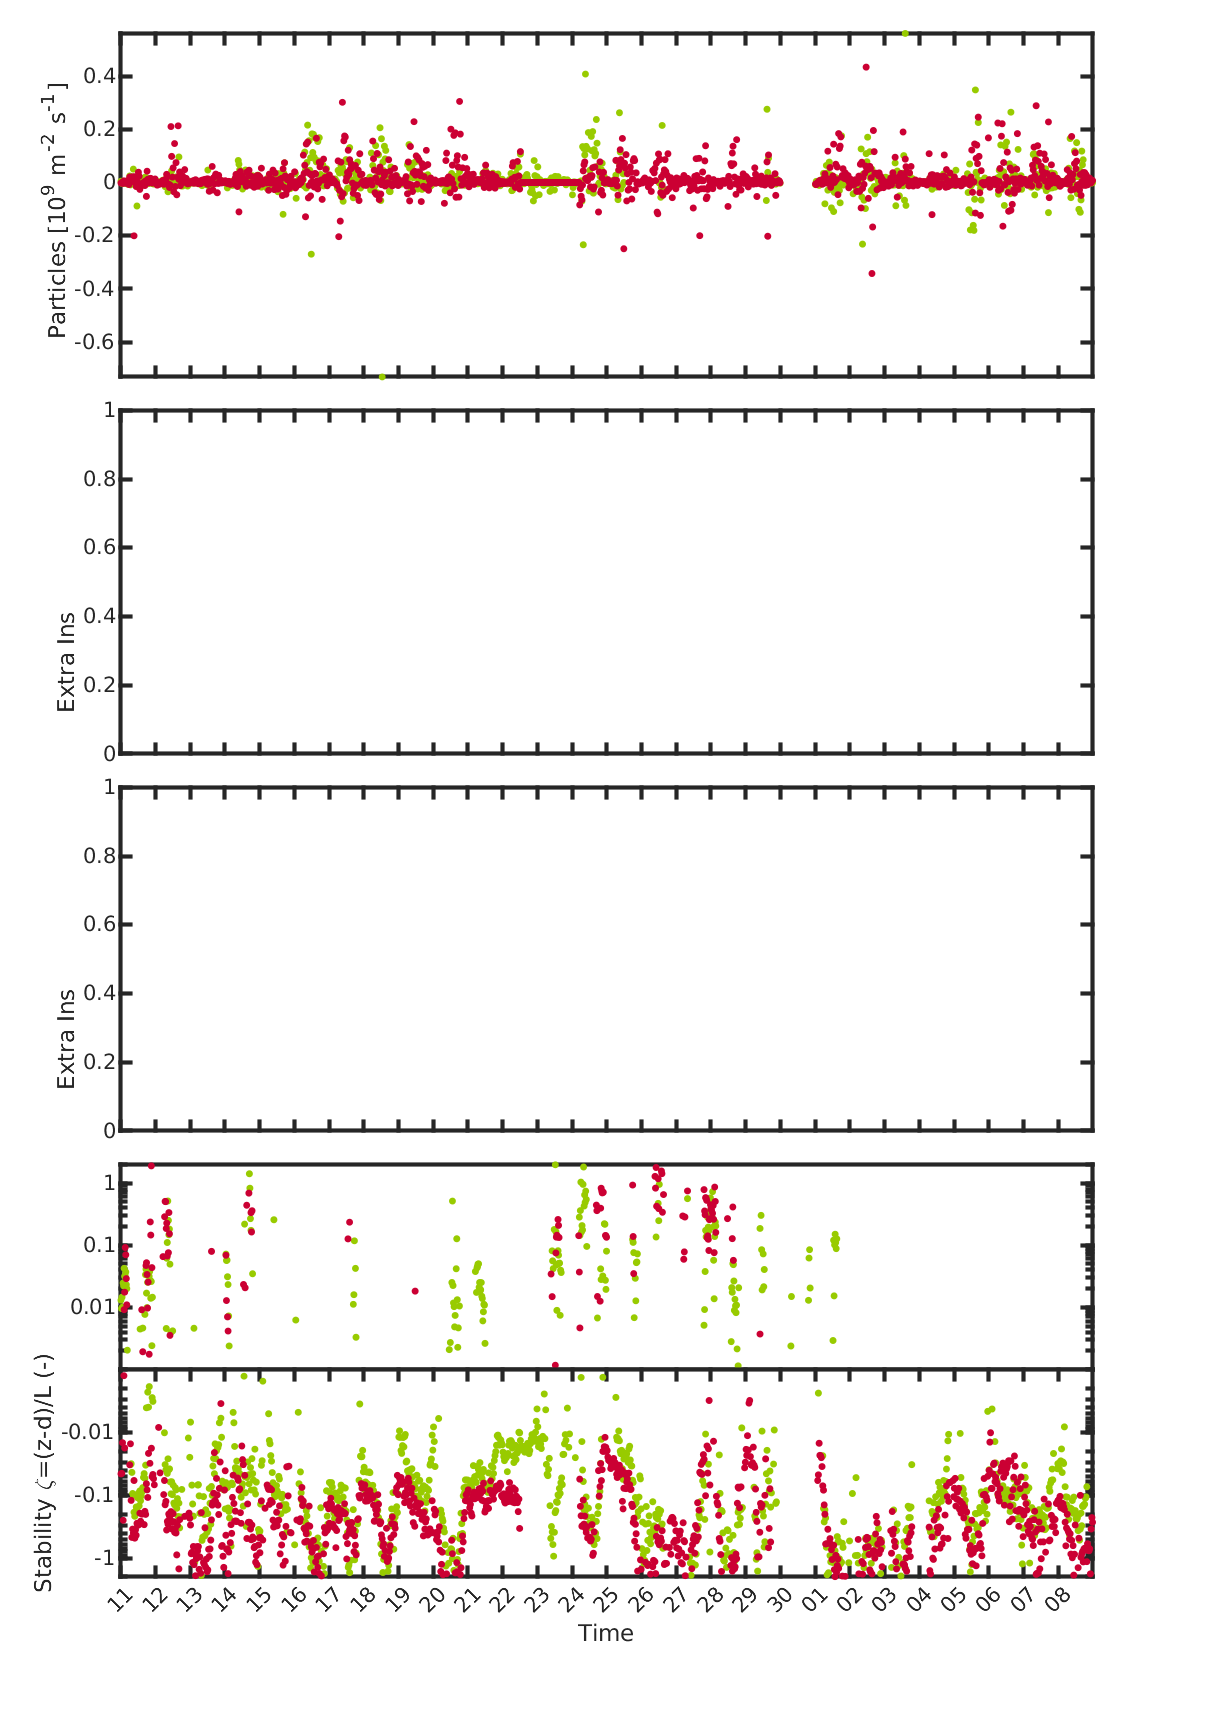
Figure 1: Time series of 30min averaged fluxes from the three sites. The fluxes have been quality checked for stationarity, intermittency, kurtosis and skewness.
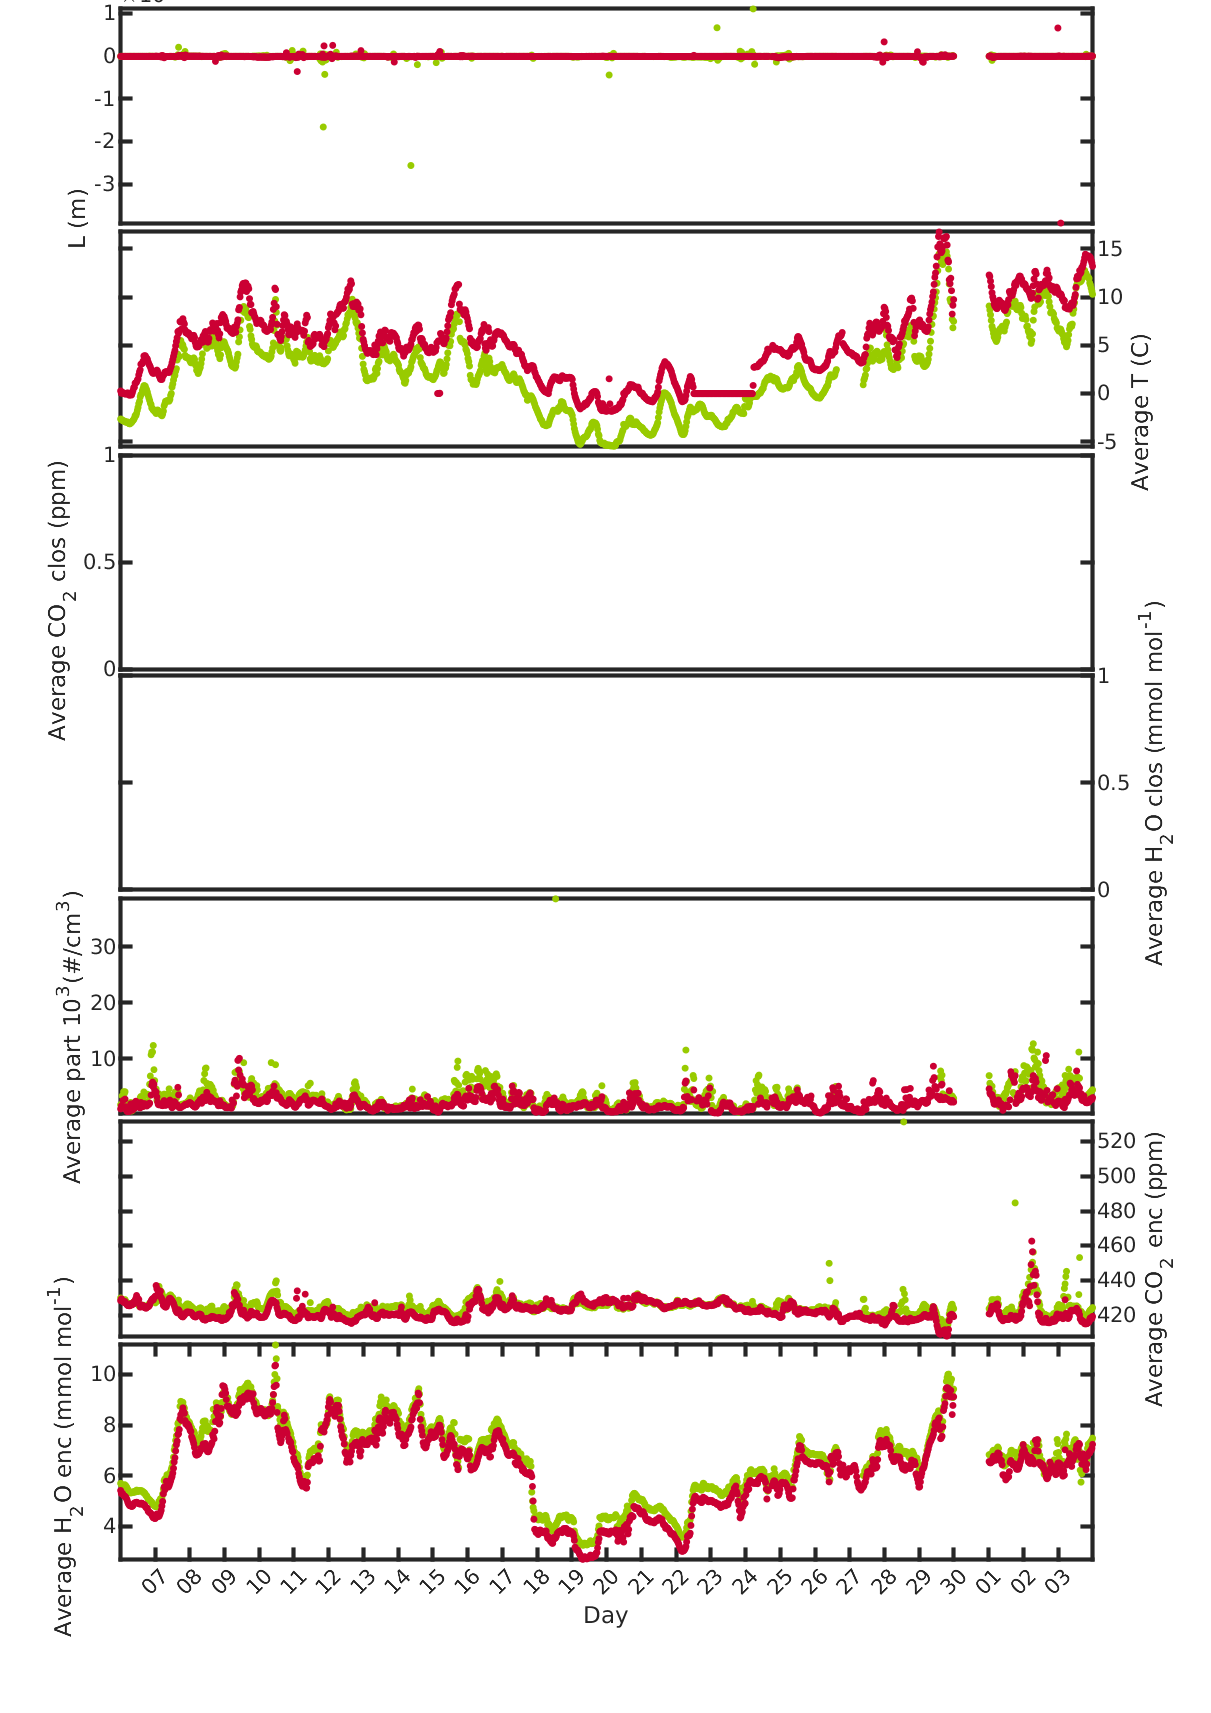
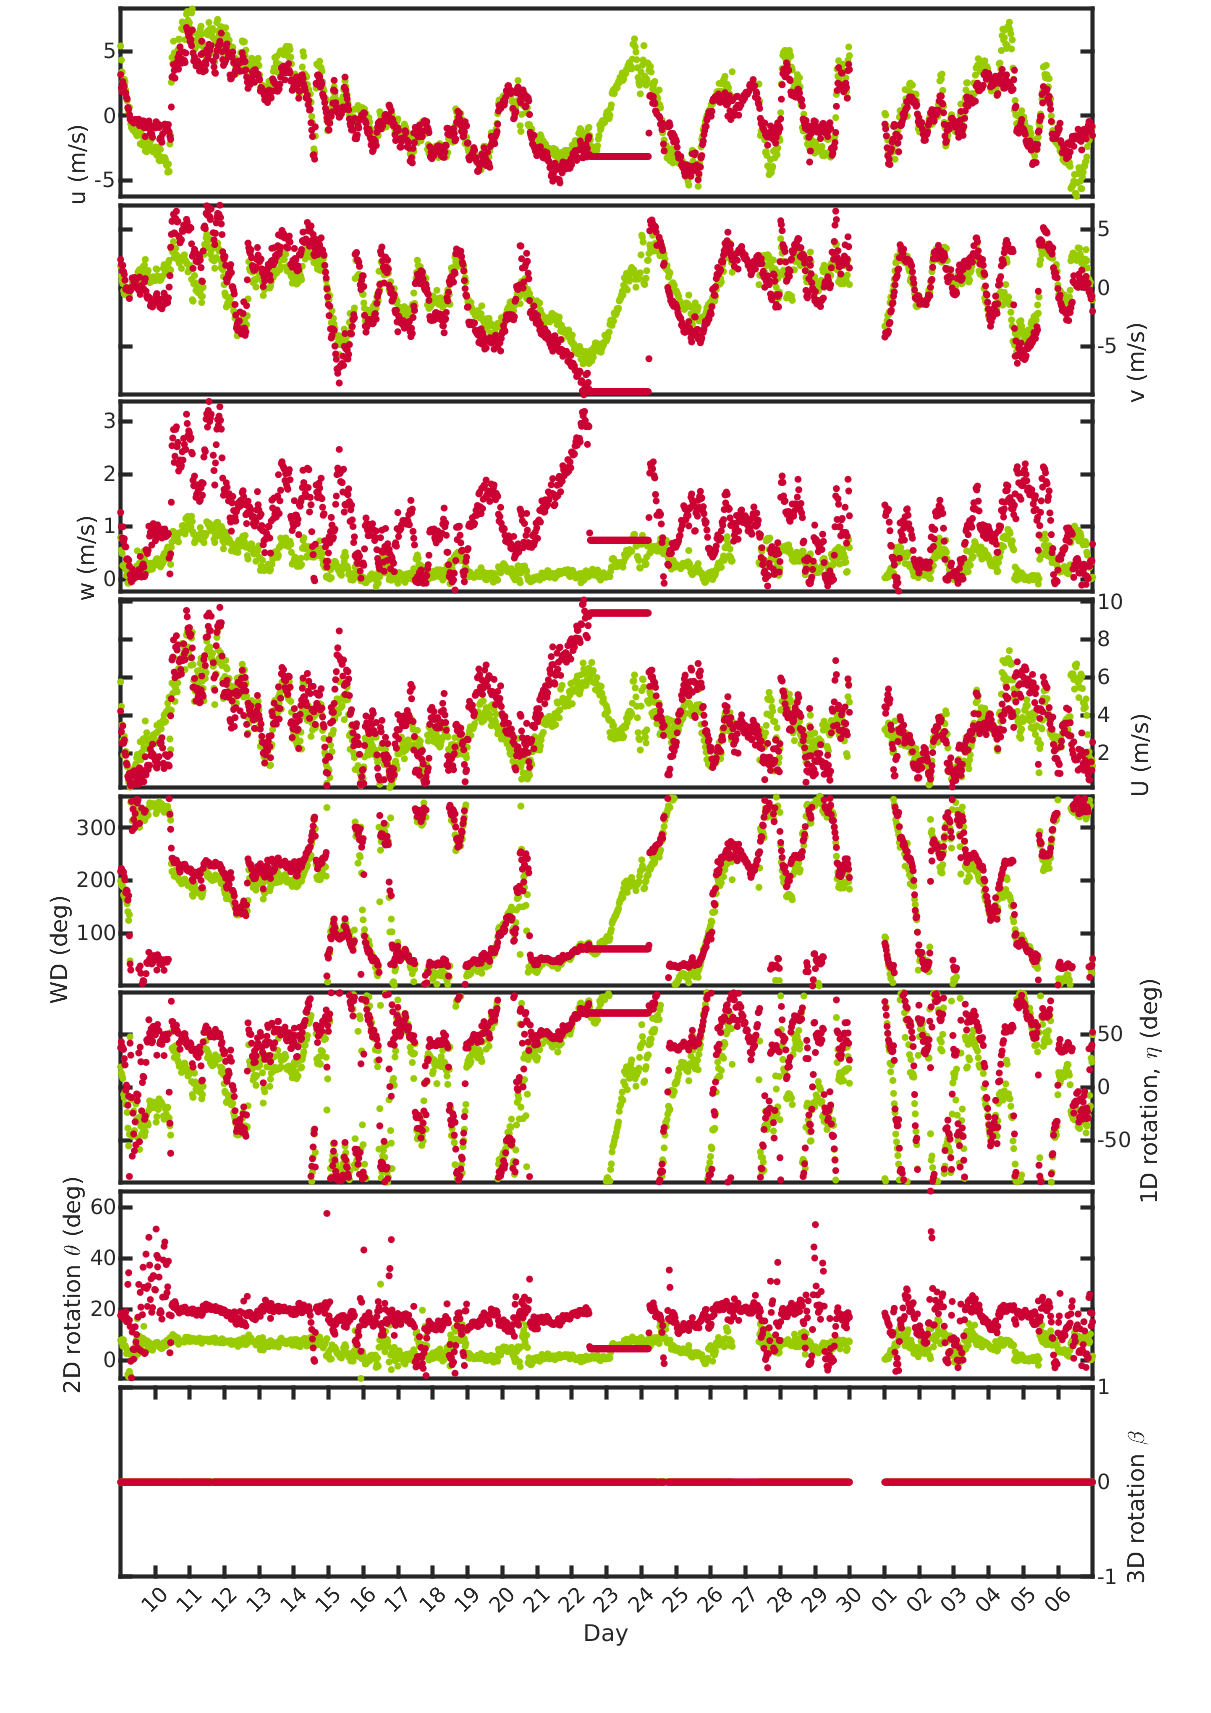
Figure 2: Time series of 30min averaged variables from the three sites. No data omittance due to flow distortion was done for these variables.

Figure 3: 30min averages of wind direction and second rotation angle.
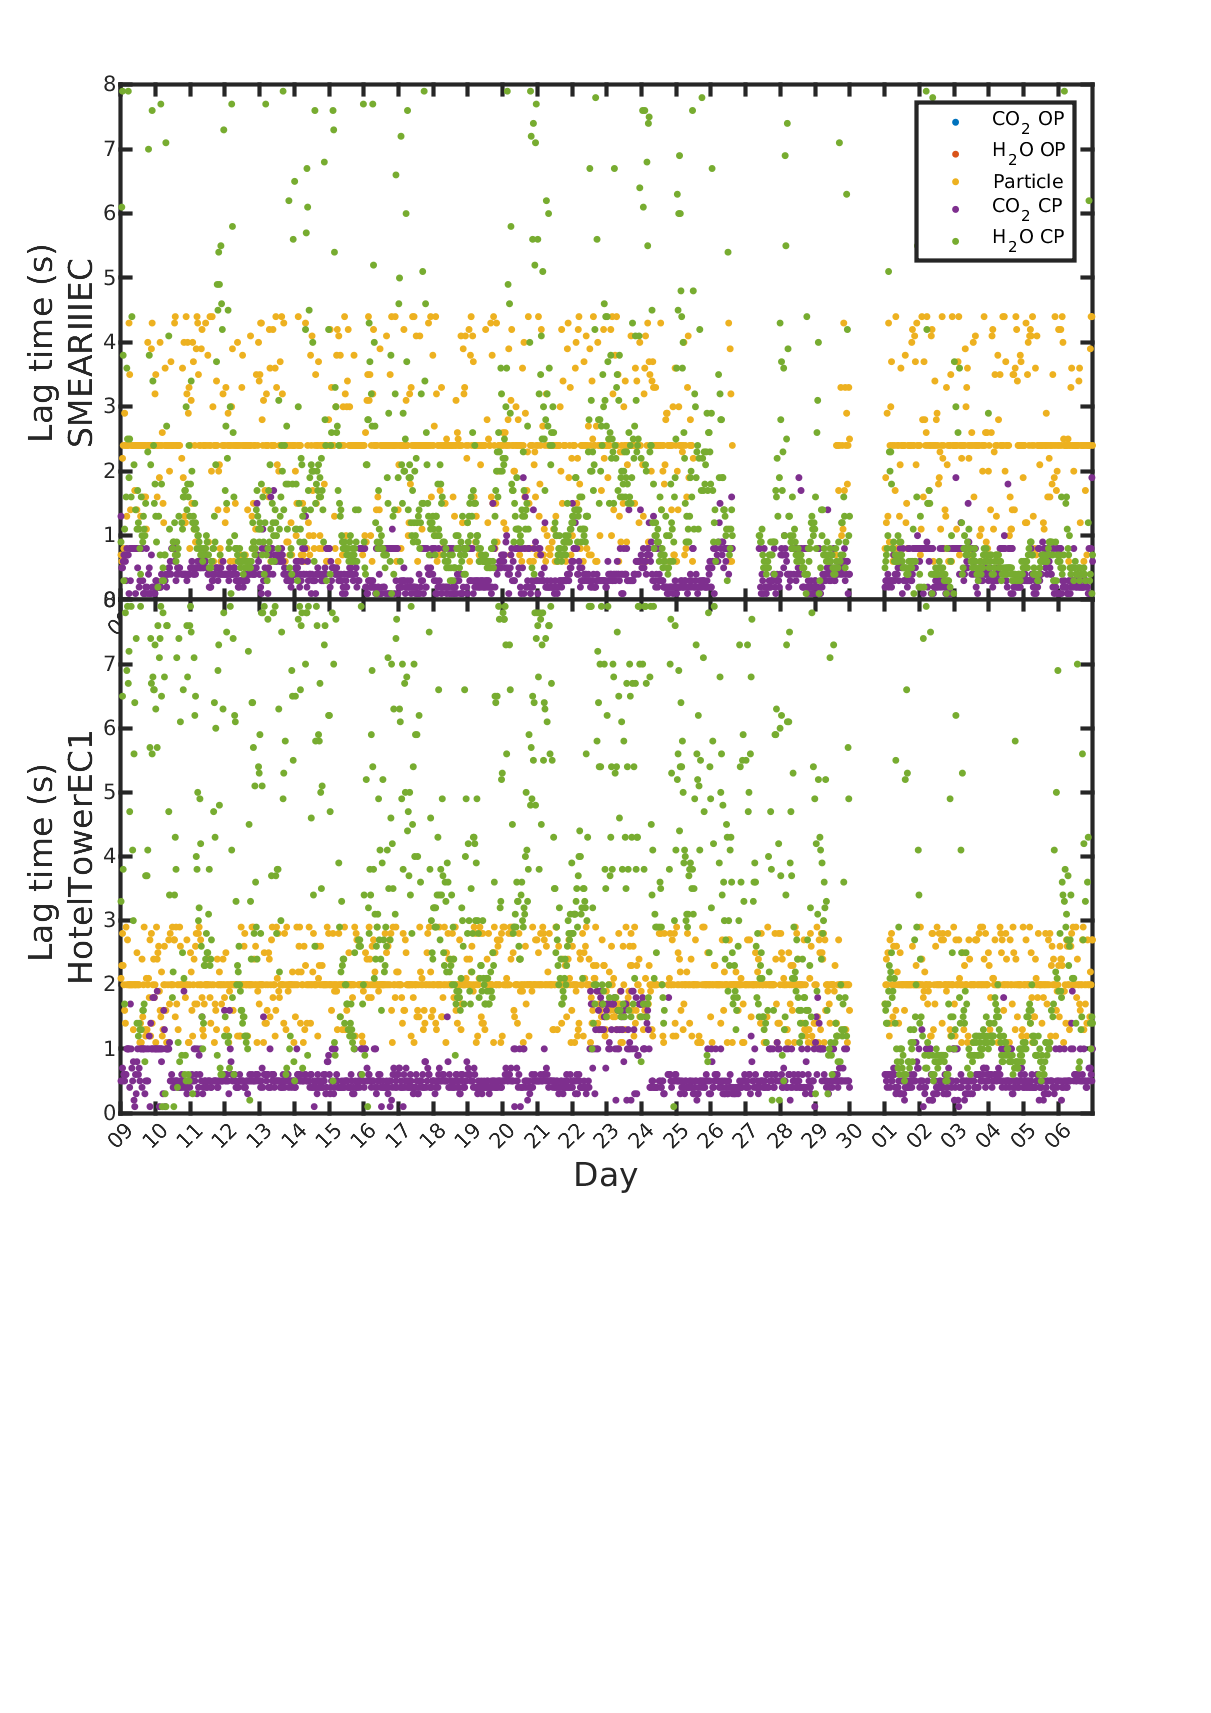
Figure 4: Lag times of closed-path (H_2O & CO_2) and particle flux measurements.
.png)
Figure 5: Lag times of closed-path (H_2O & CO_2) as a function of relative humidity.
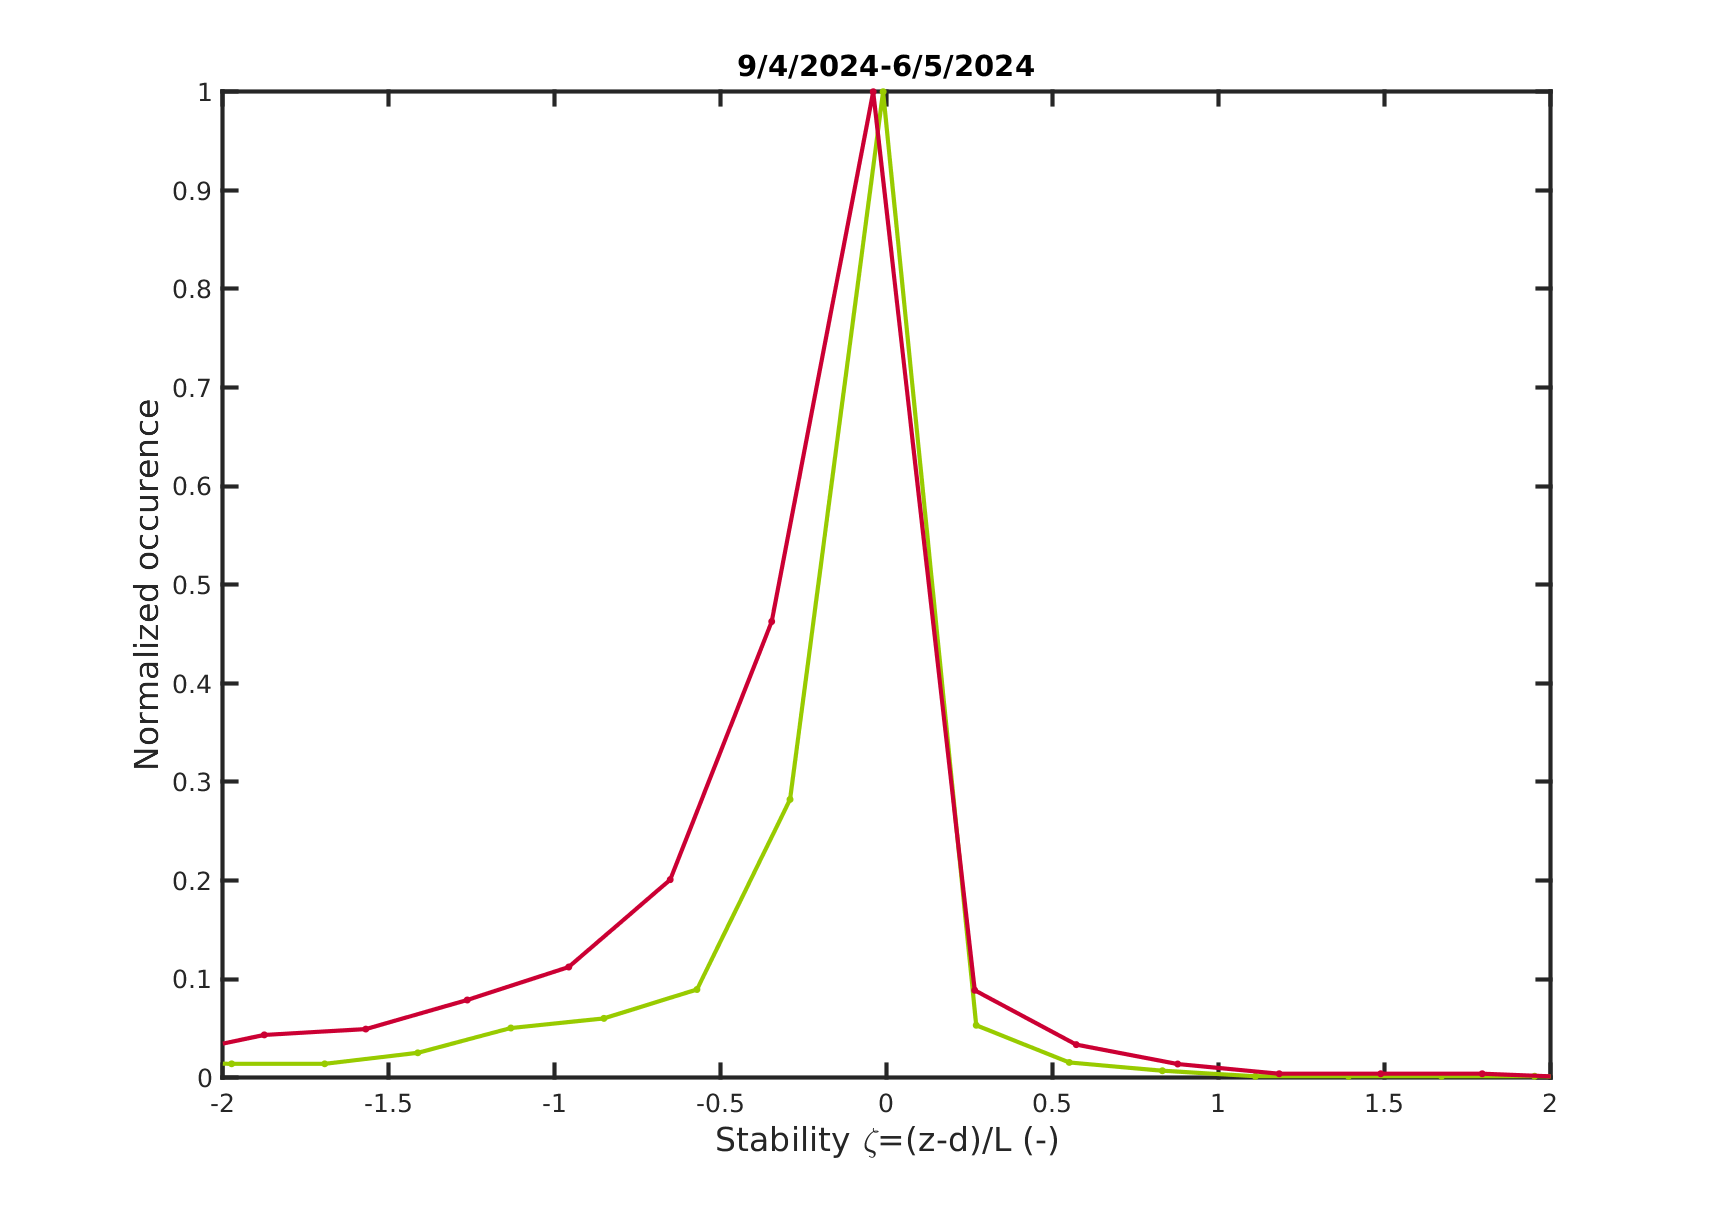
Figure 6: Distribution of atmospheric stability.
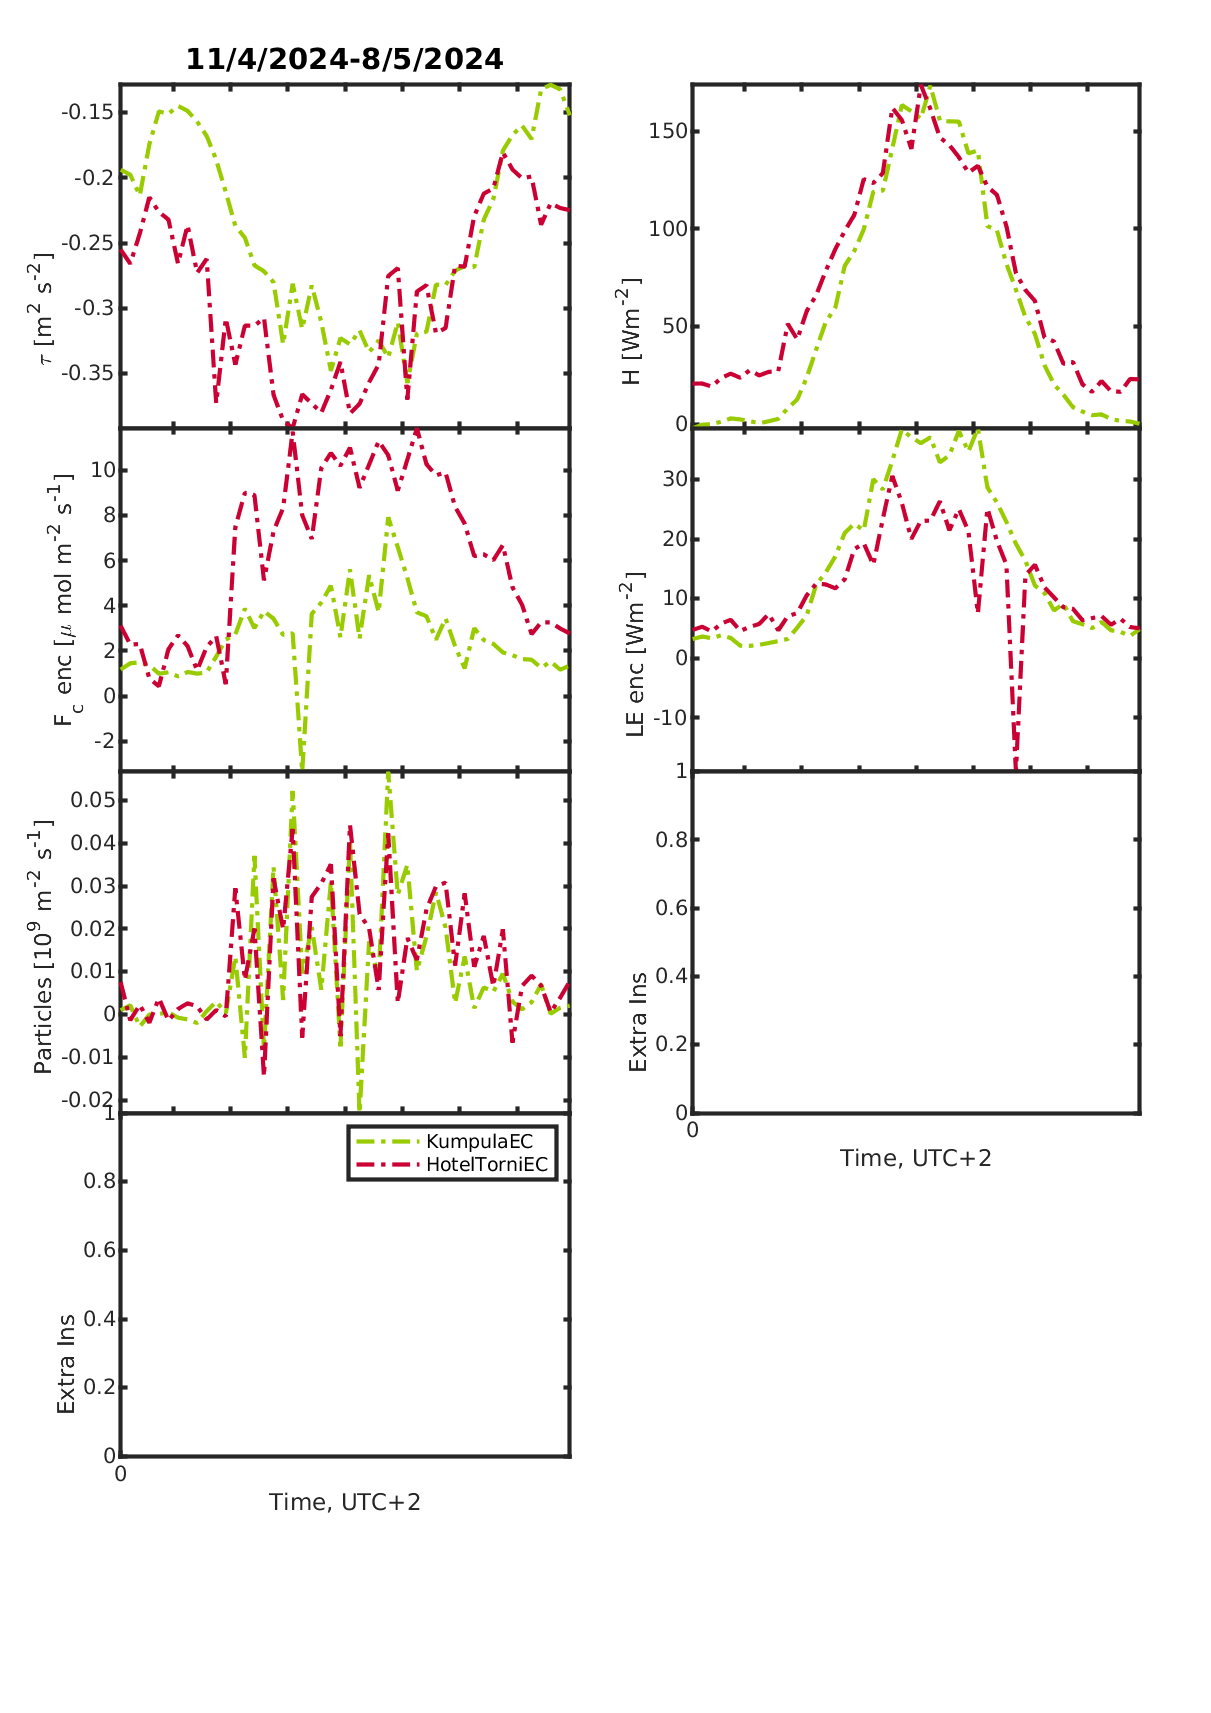
Figure 7: Diurnal variation of fluxes.
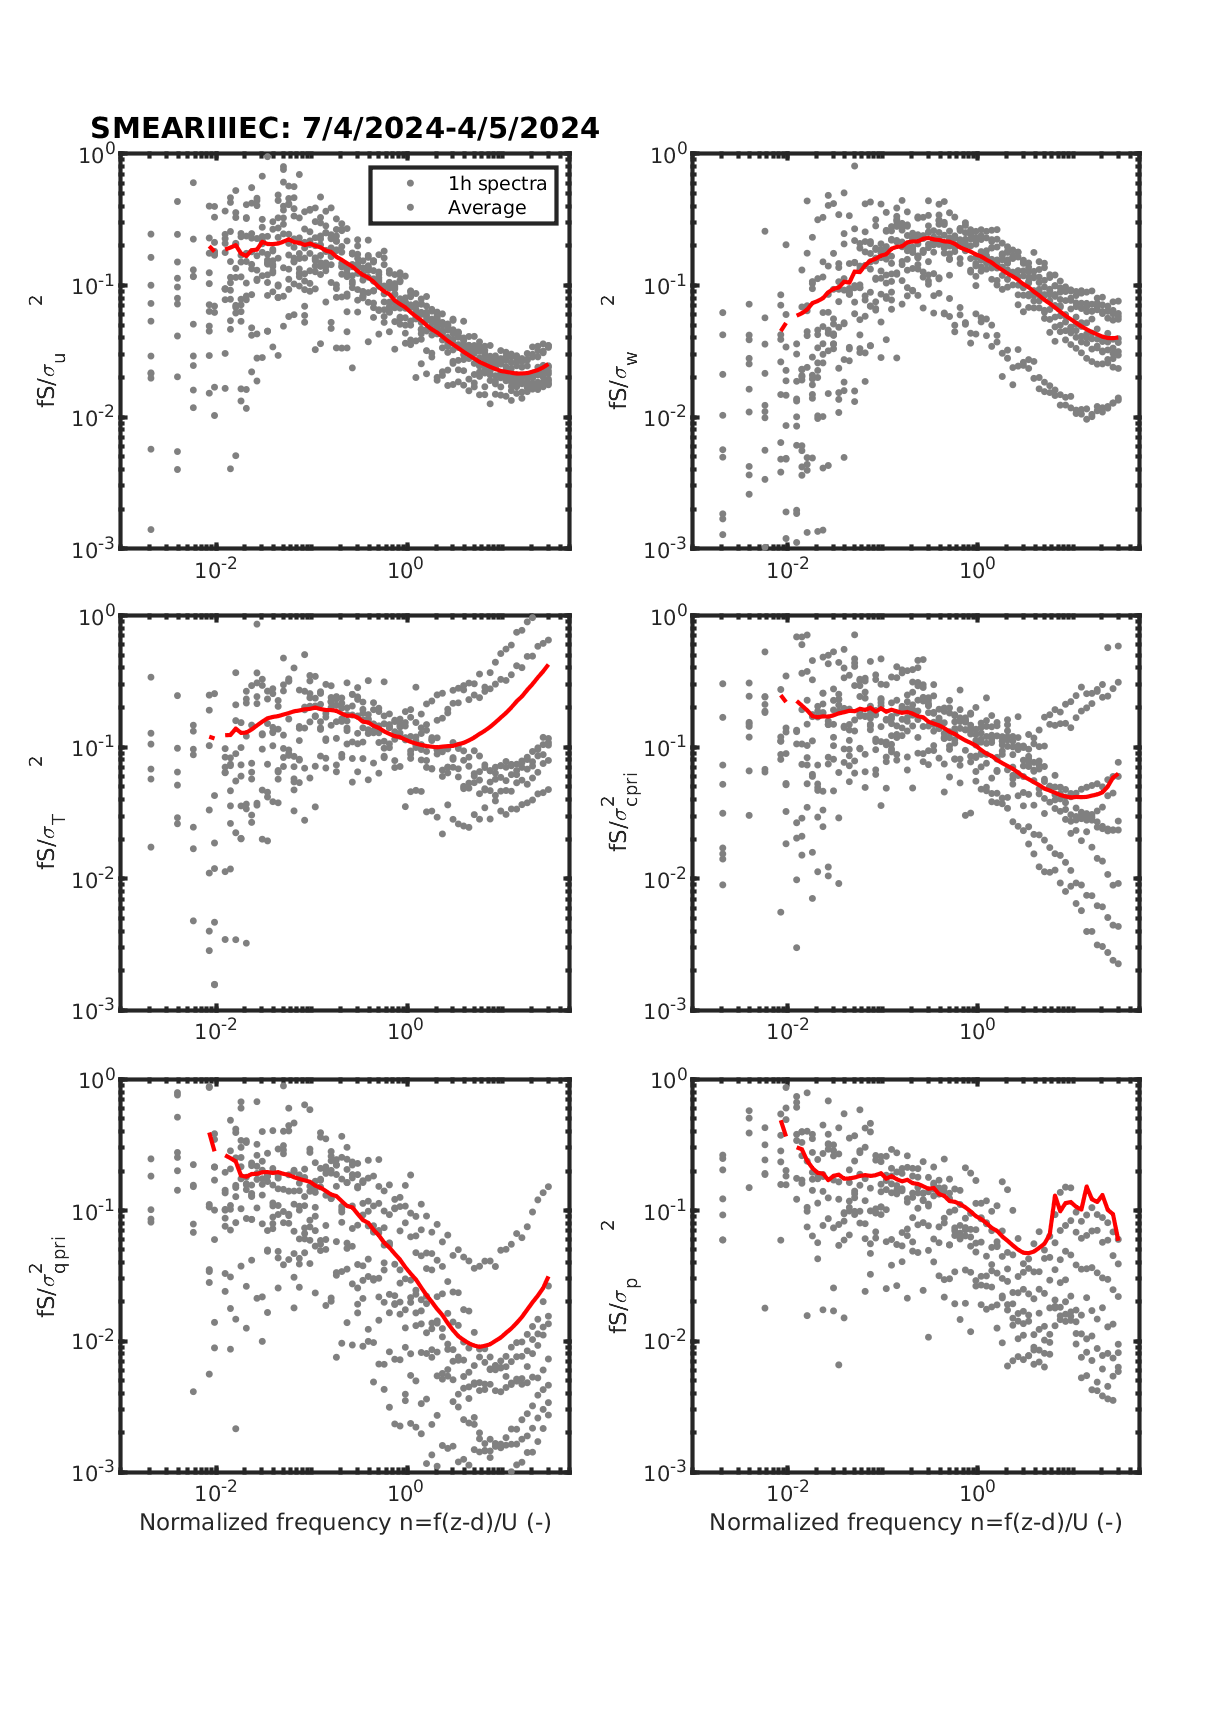
Figure 8: 60min power spectra at Kumpula.
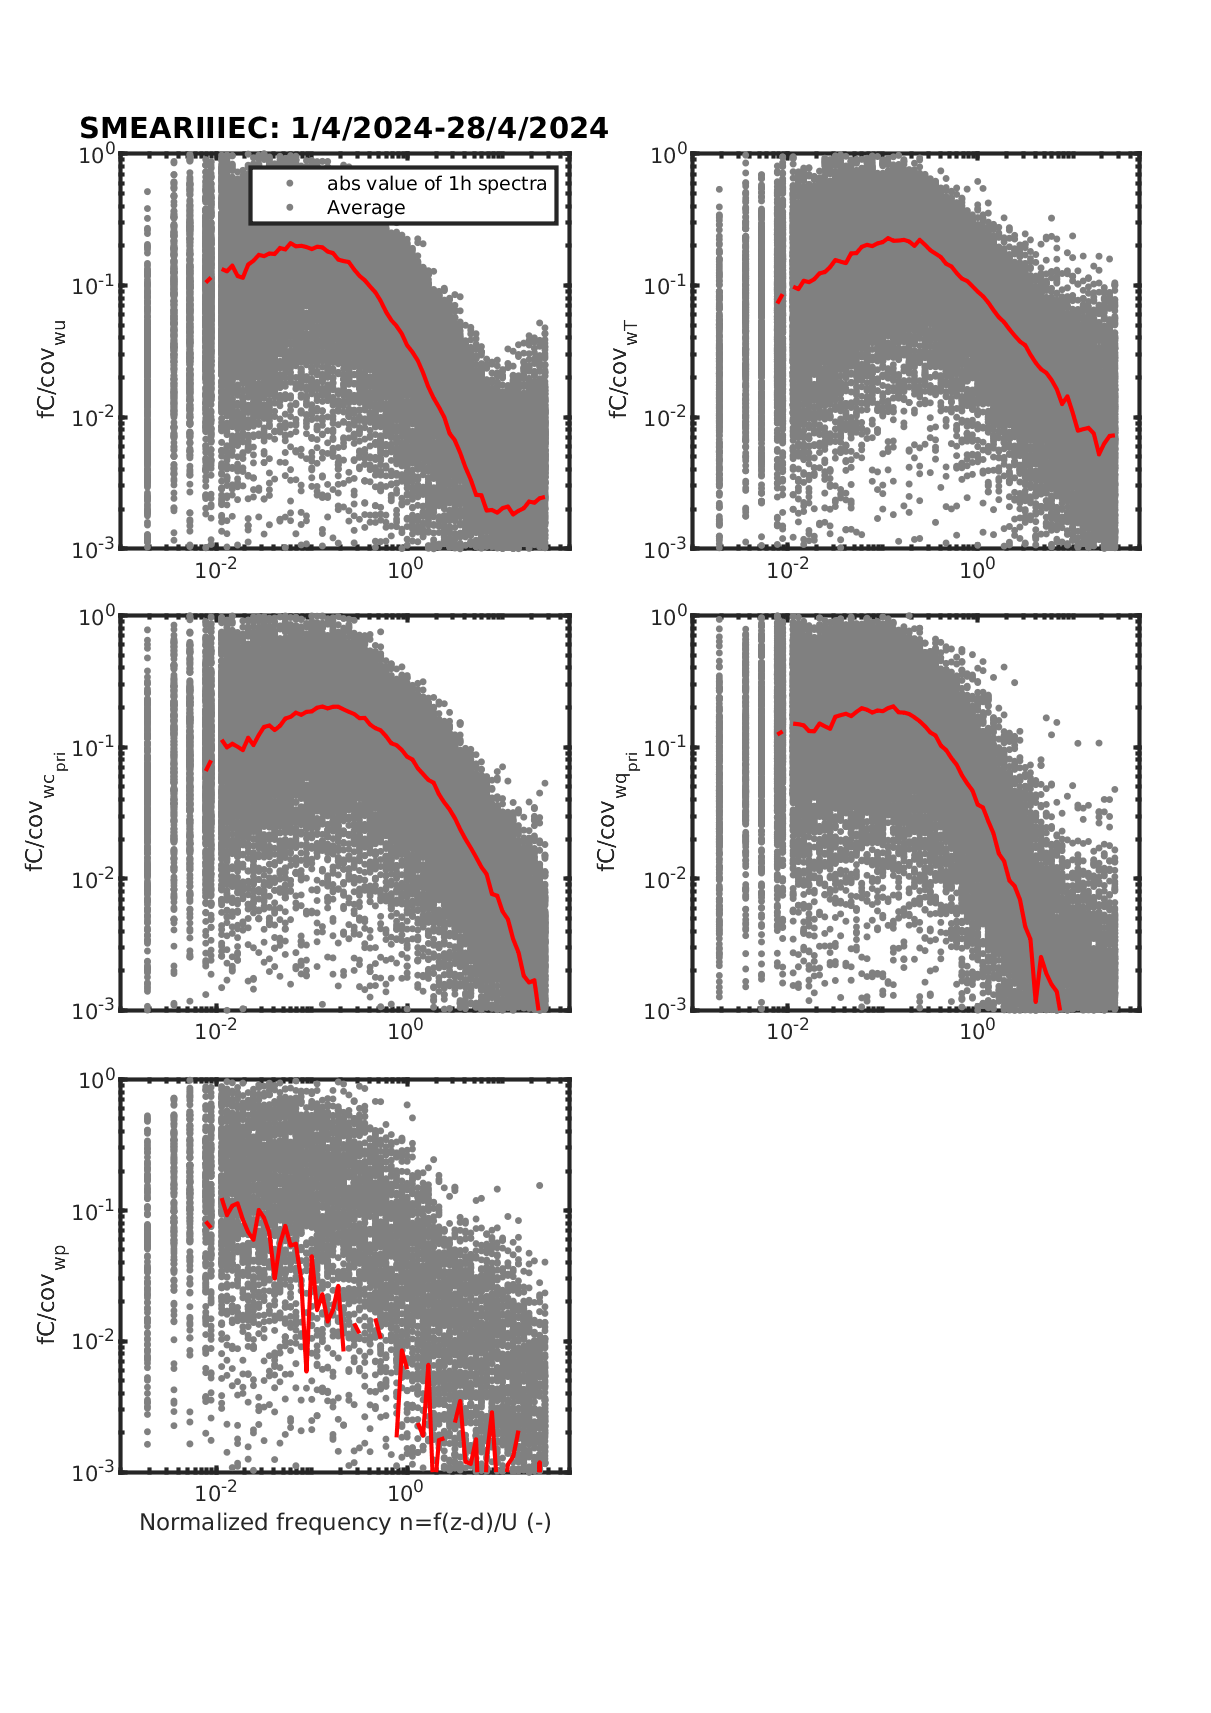
Figure 9: 60min co-spectra at Kumpula.
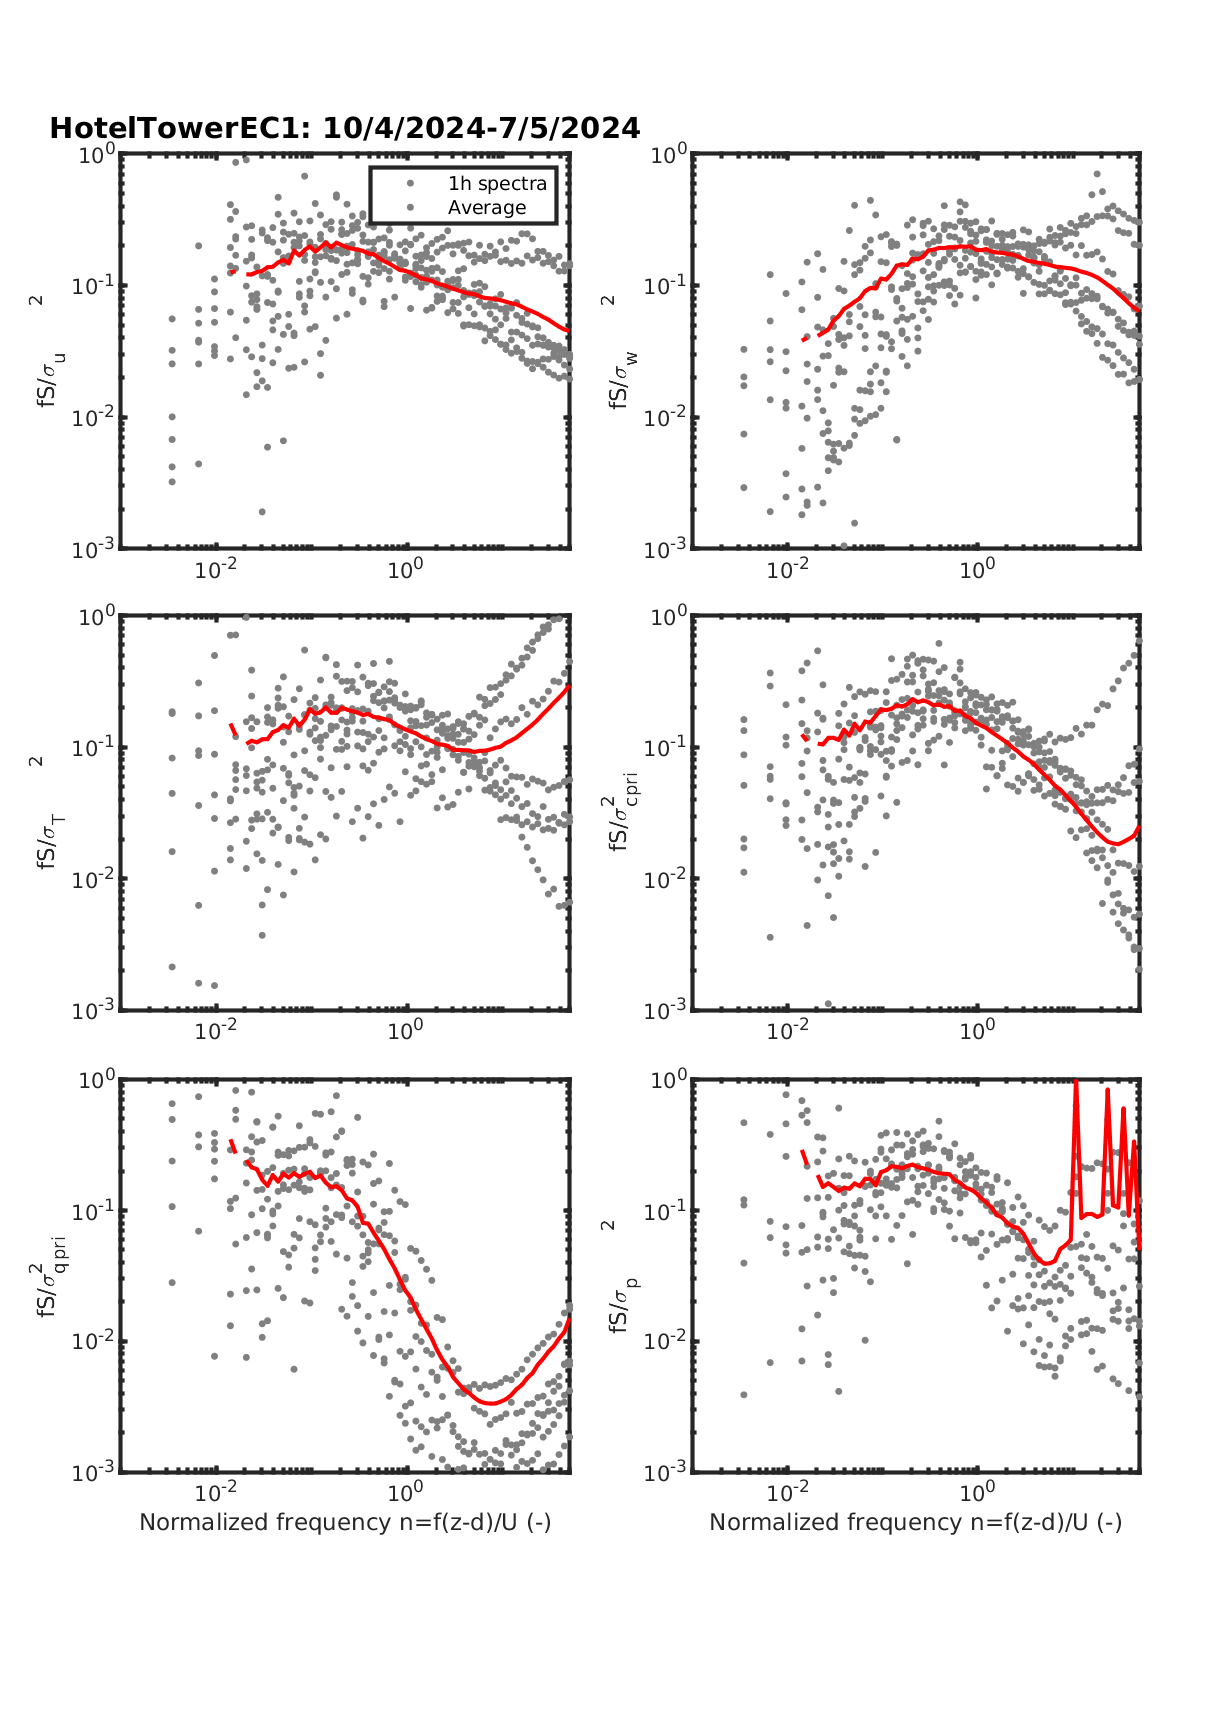
Figure 10: 60min power spectra at Hotel Torni EC.
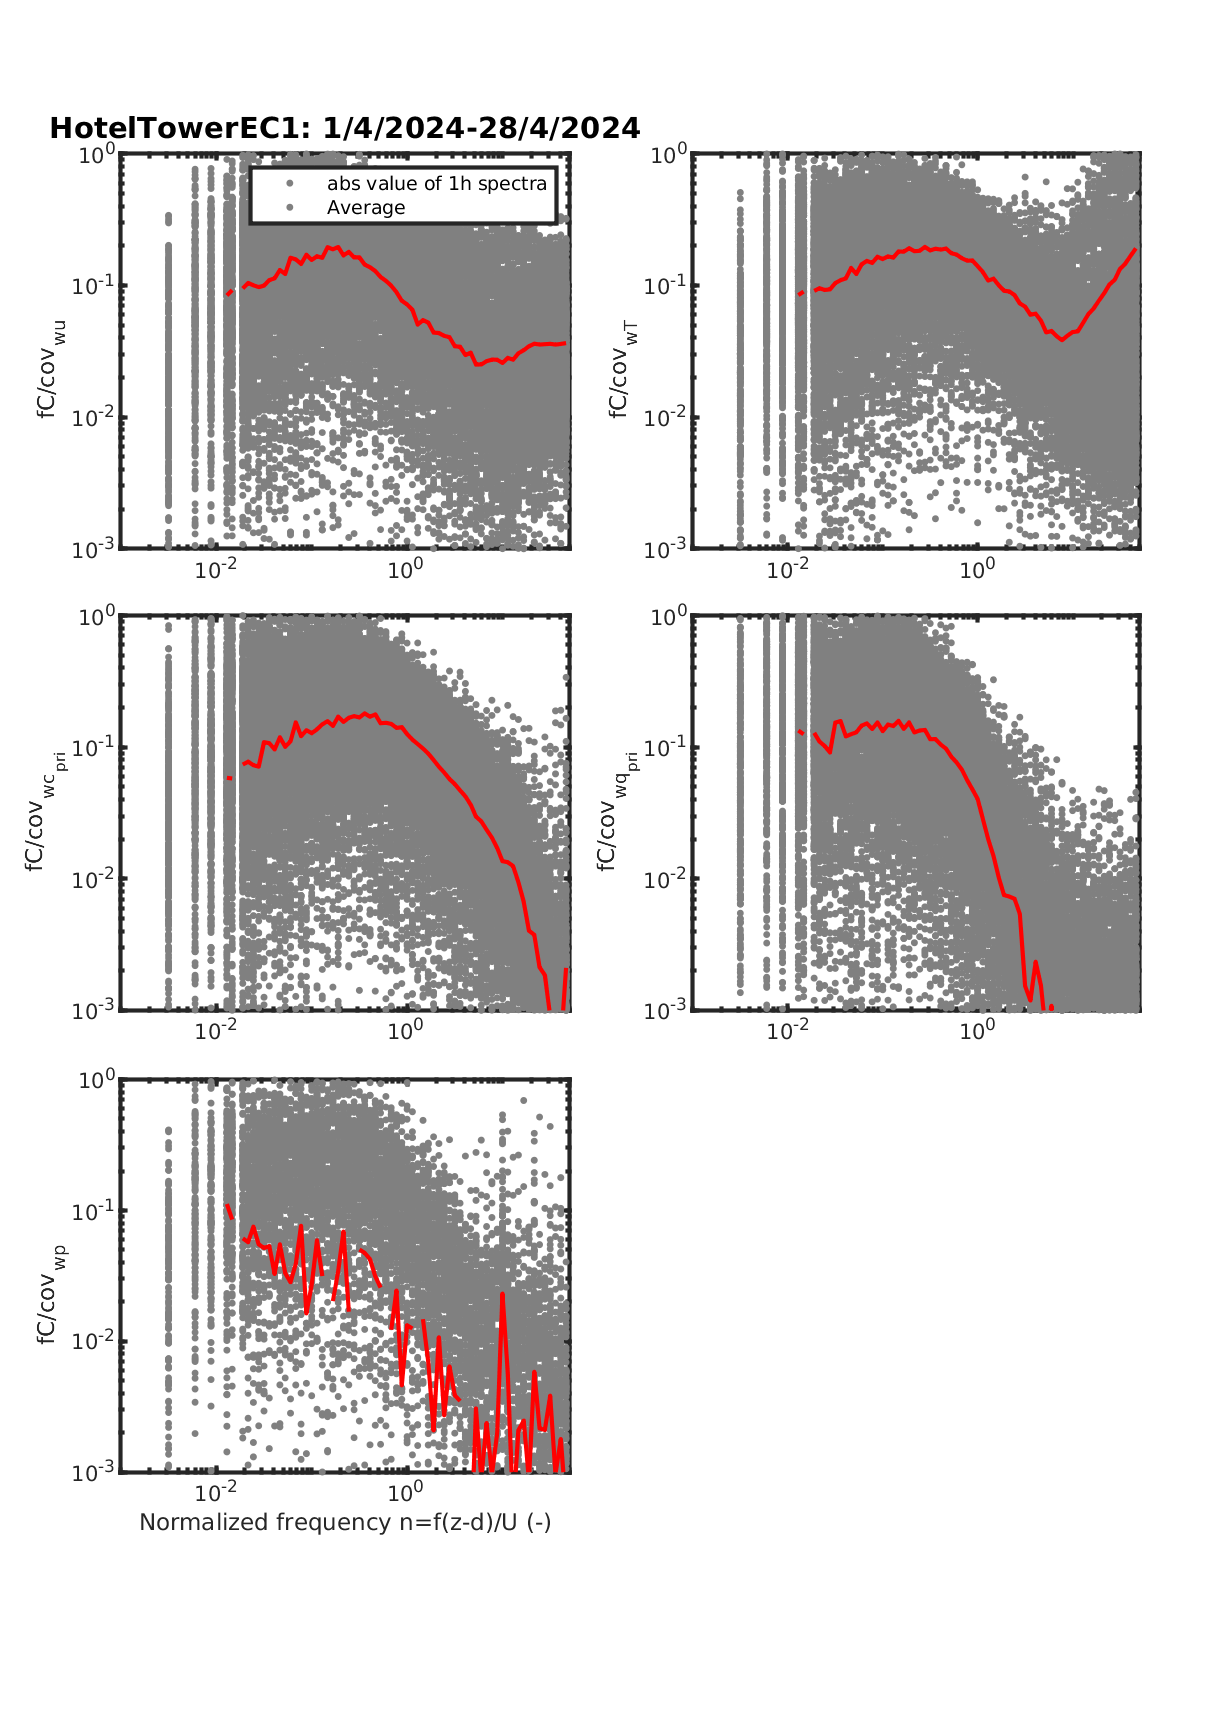
Figure 11: 60min co-spectra at Hotel Torni EC.
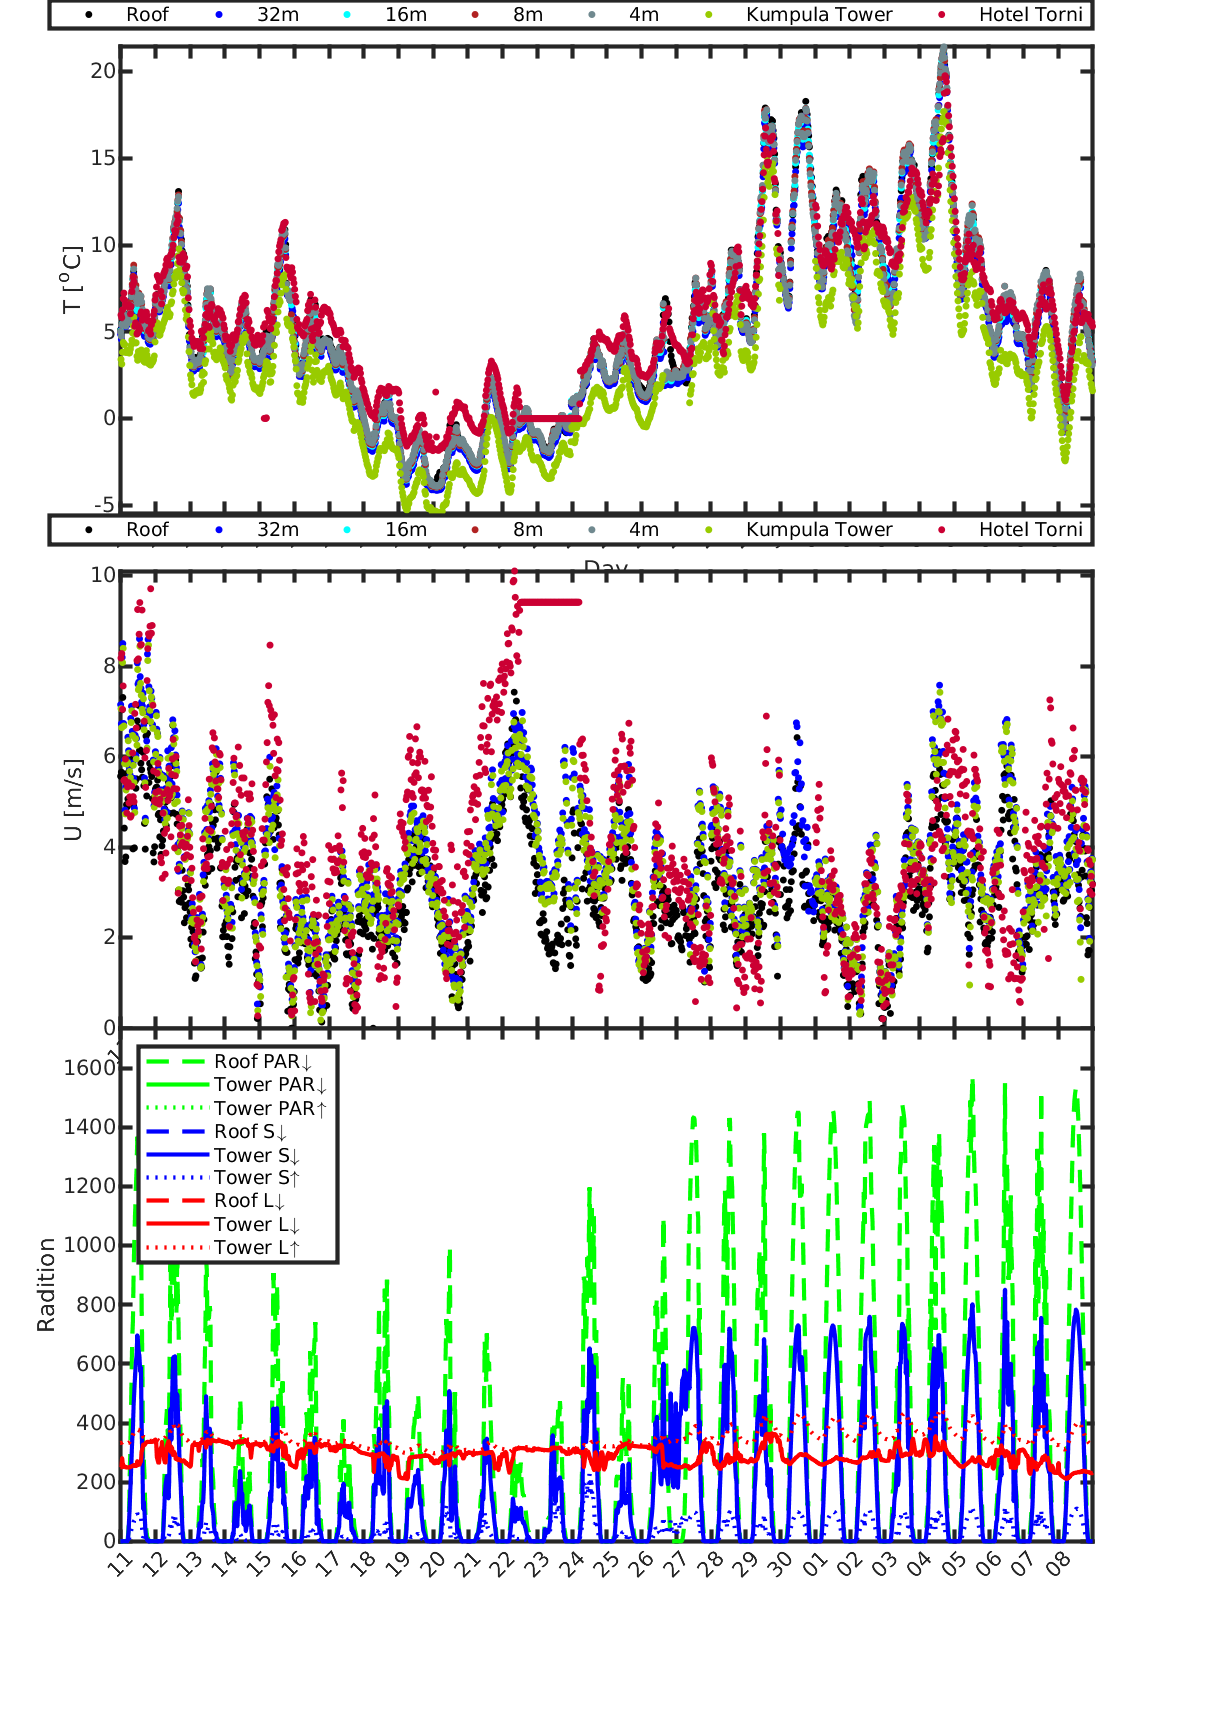
Figure 19: Temperature, wind speed and radiation components
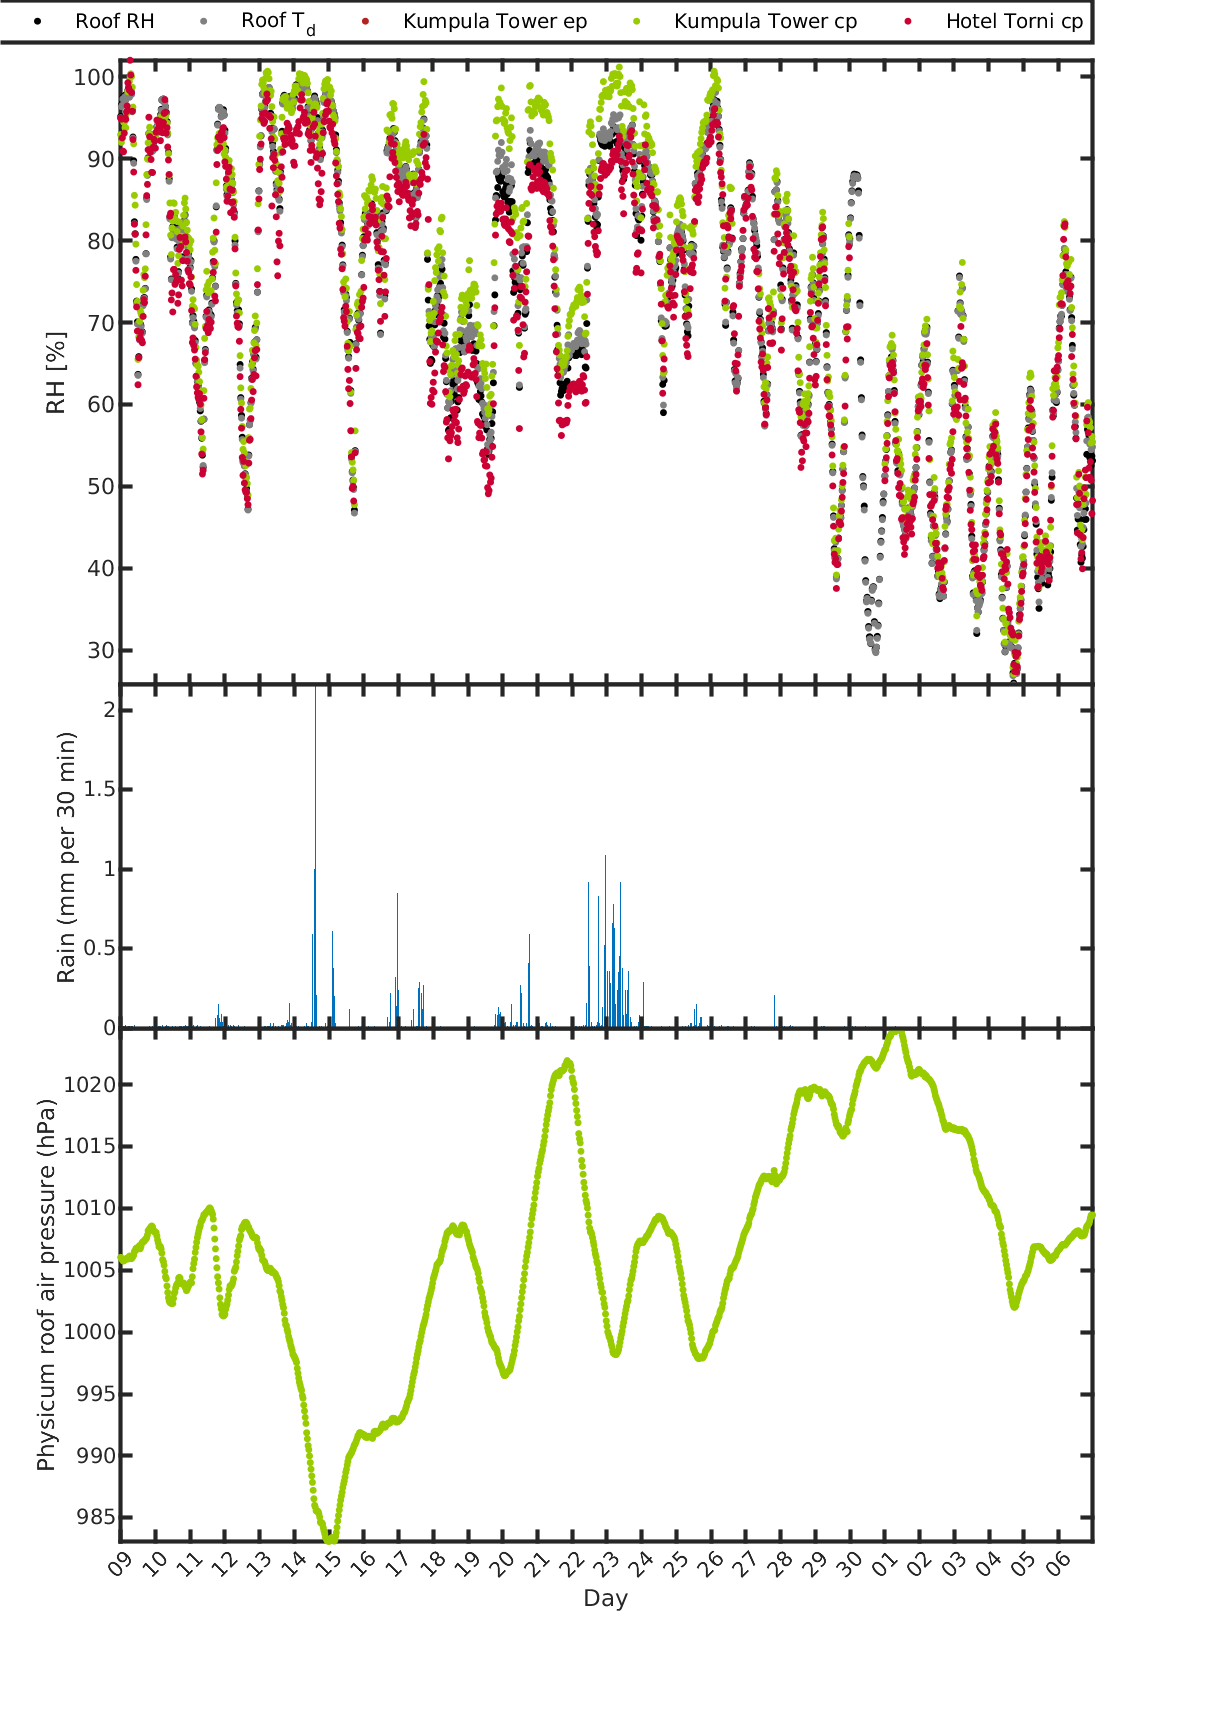
Figure 20: Humidity, rain and pressure