
Other EC sites:
Siikaneva I
SMEAR II subcanopy
SMEAR I (Värriö)
SMEAR II 27.0m
Kuivajärvi EC measurements
This page contains plots of data from Kuivajärvi EC system.
The figures are intended for detecting instrument's failure and they are updated daily. Data are not quality checked.
You can find the site diary here (the link works only within the University network).
Choose figure category:
Fluxes
Means
Lag times
Spikes
Flow distortion
Spectra/Cospectra
Spectral attenuation
Meteorological/auxiliary data
Meteorological/auxiliary data.
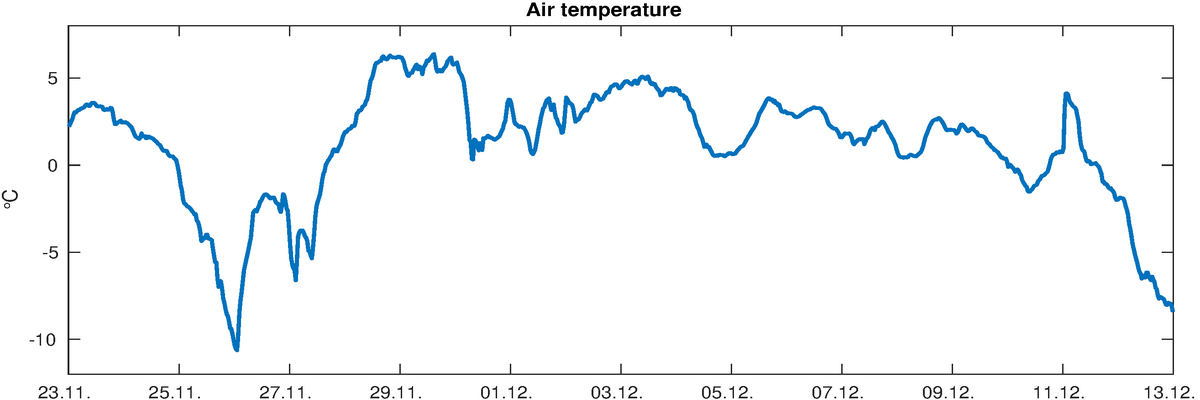
Figure 1: Air temperature.
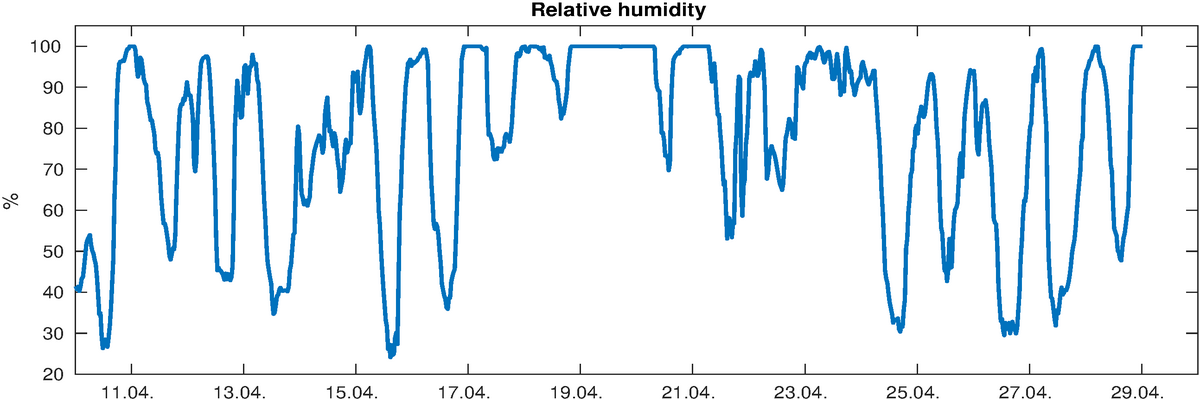
Figure 2: Relative humidity.
Figure 3: Lake temperature profile.
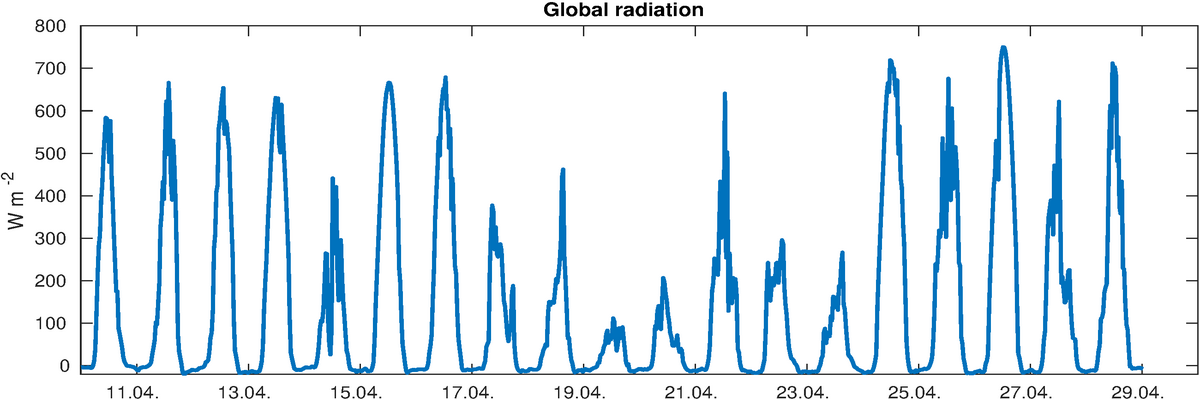
Figure 4: Shortwave radiation above the lake.
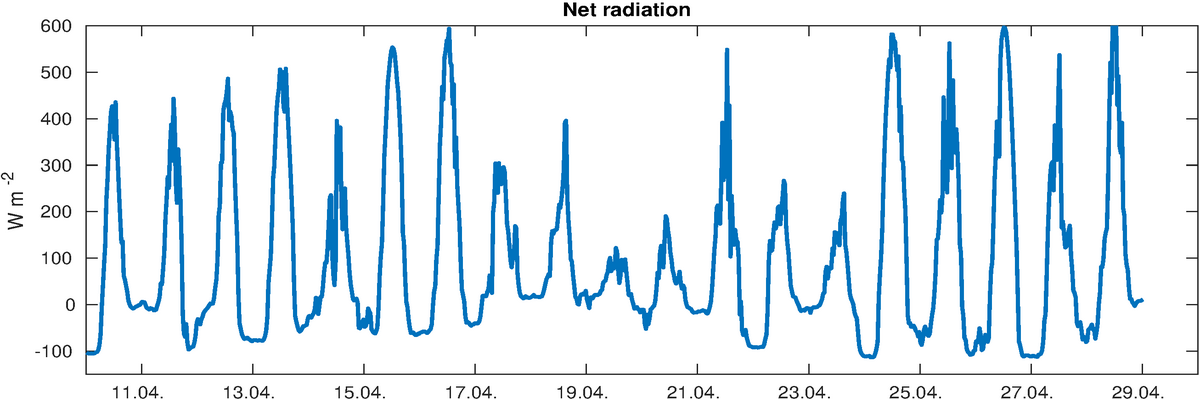
Figure 5: Net radiation above the lake.
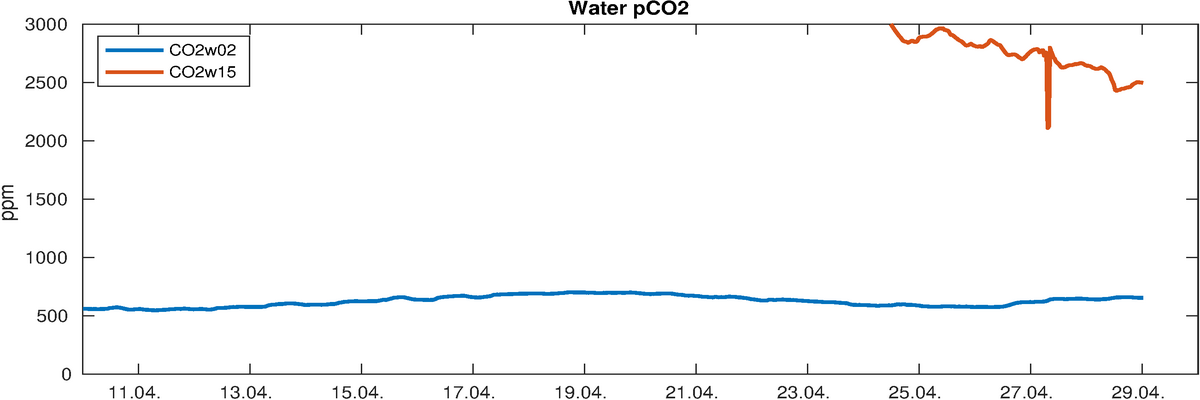
Figure 6: CO2 concentration profile in the lake.