

Other EC sites:
Kuivajärvi
Siikaneva I
SMEAR II subcanopy
SMEAR I (Värriö)
SMEAR II 27.0m
SMEAR II EC measurements at tower (23 m)
This page contains plots of data from SMEAR II EC system located at 23 m height in the tower.
The figures are intended for detecting instrument's failure and they are updated daily. Data are not quality checked.
You can find the site diary here (the link works only within the University network).
Choose figure category:
Fluxes
Means
Lag times
Spikes
Flow distortion
Spectra/Cospectra
Spectral attenuation
Site comparison
Meteorological/auxiliary data
High frequency response of the EC system.
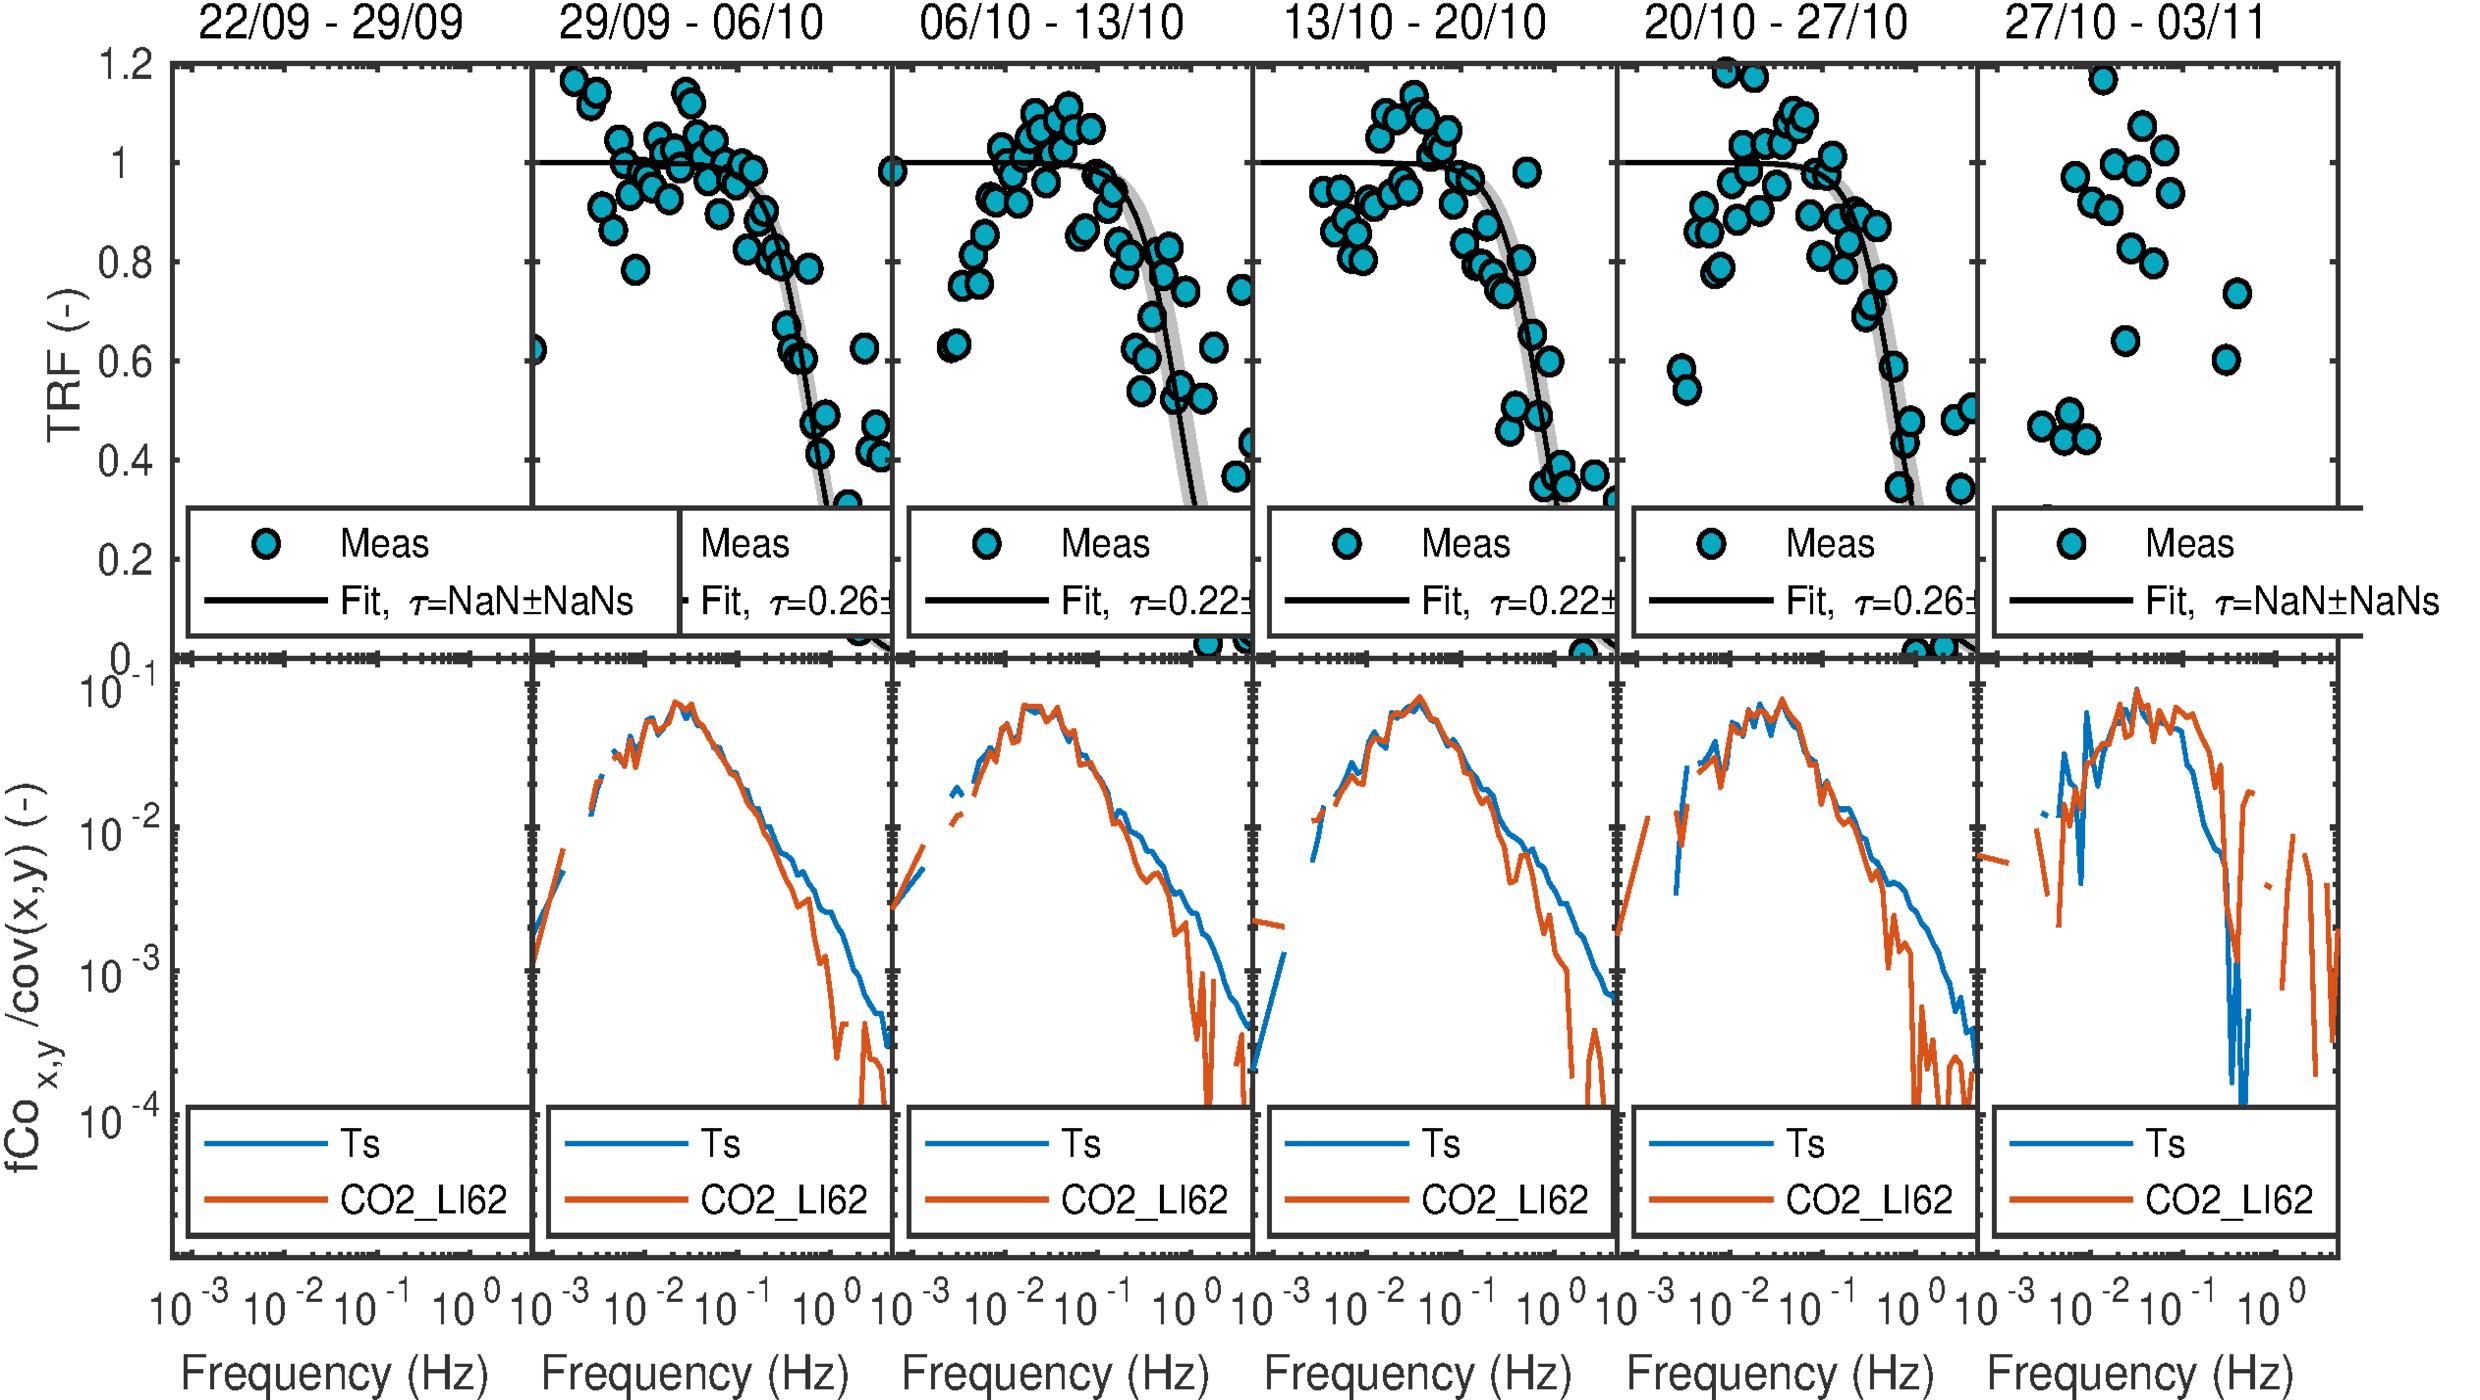

Figure 1: Experimental transfer functions within 7 day windows.
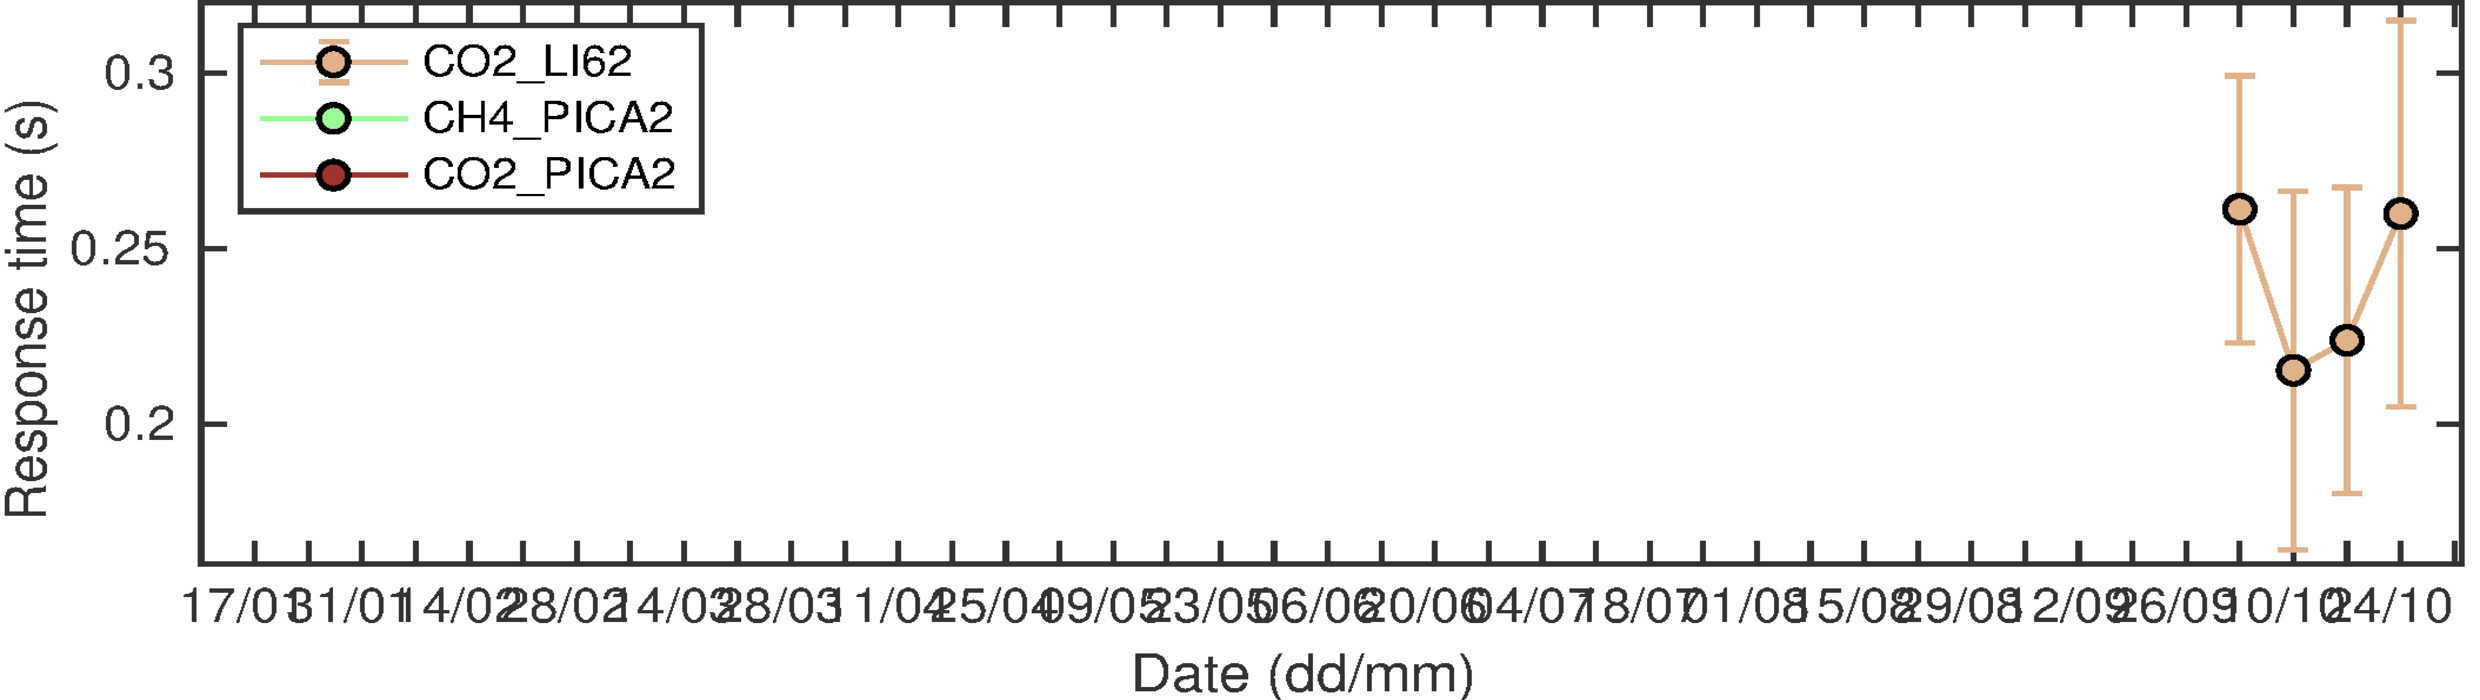
Figure 2: Time series of response times within 7 day windows during this year.
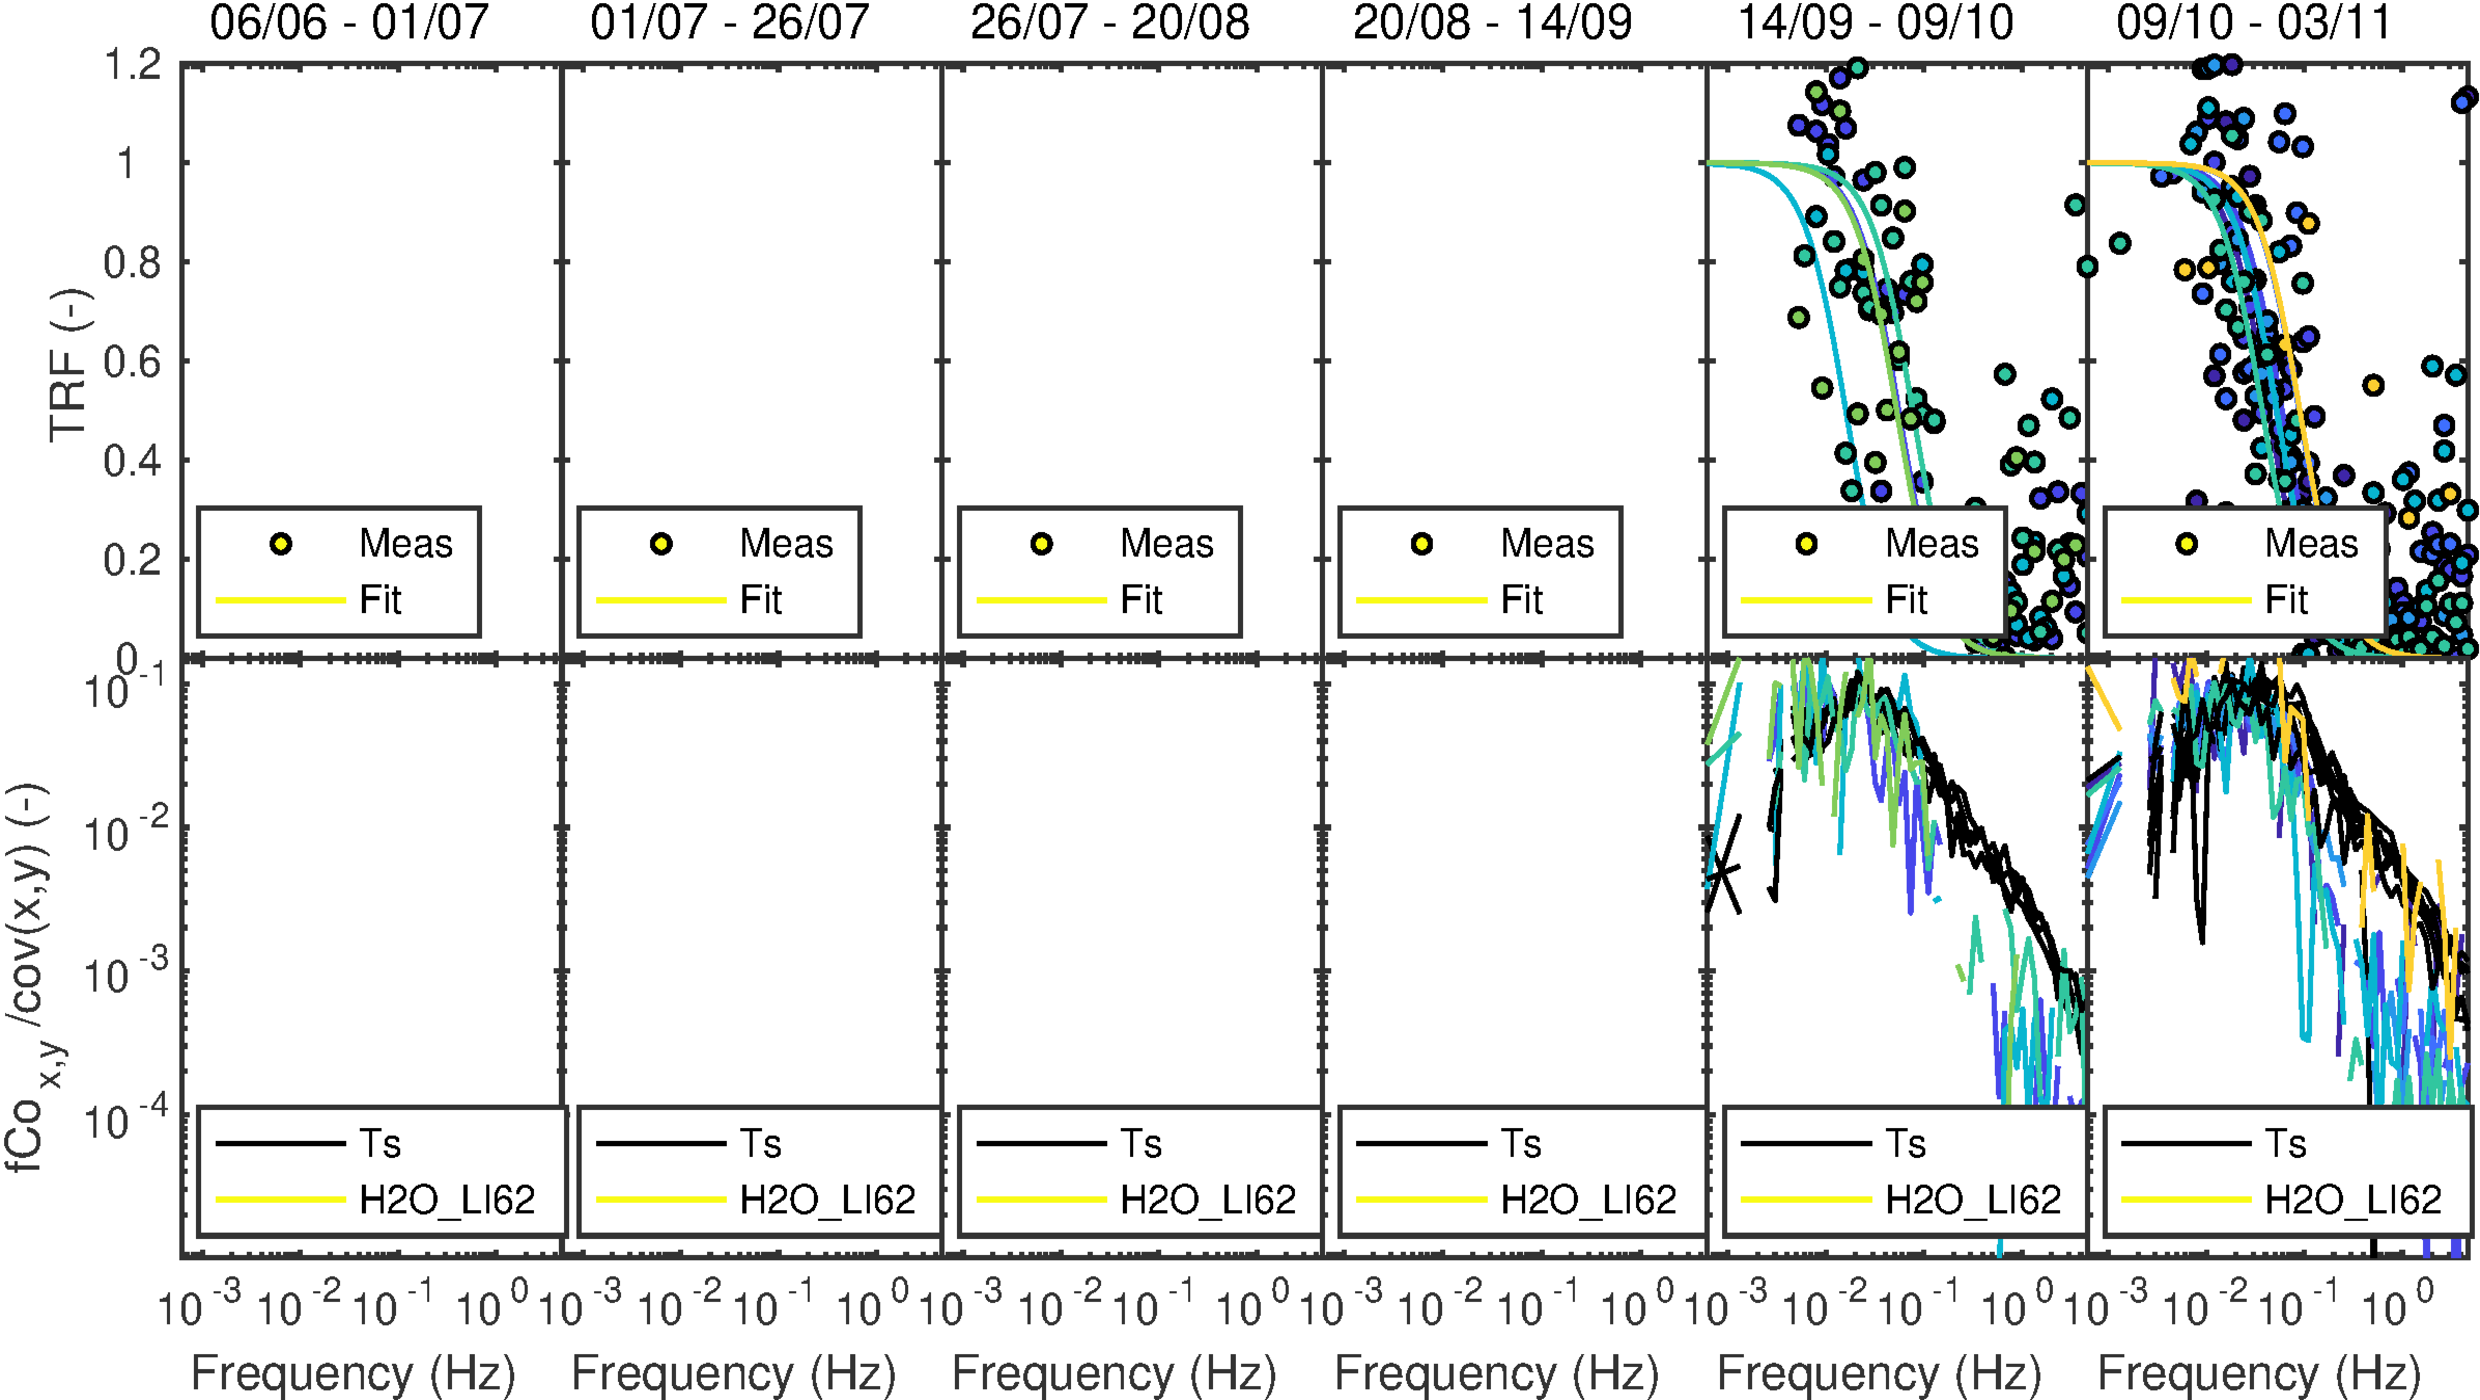
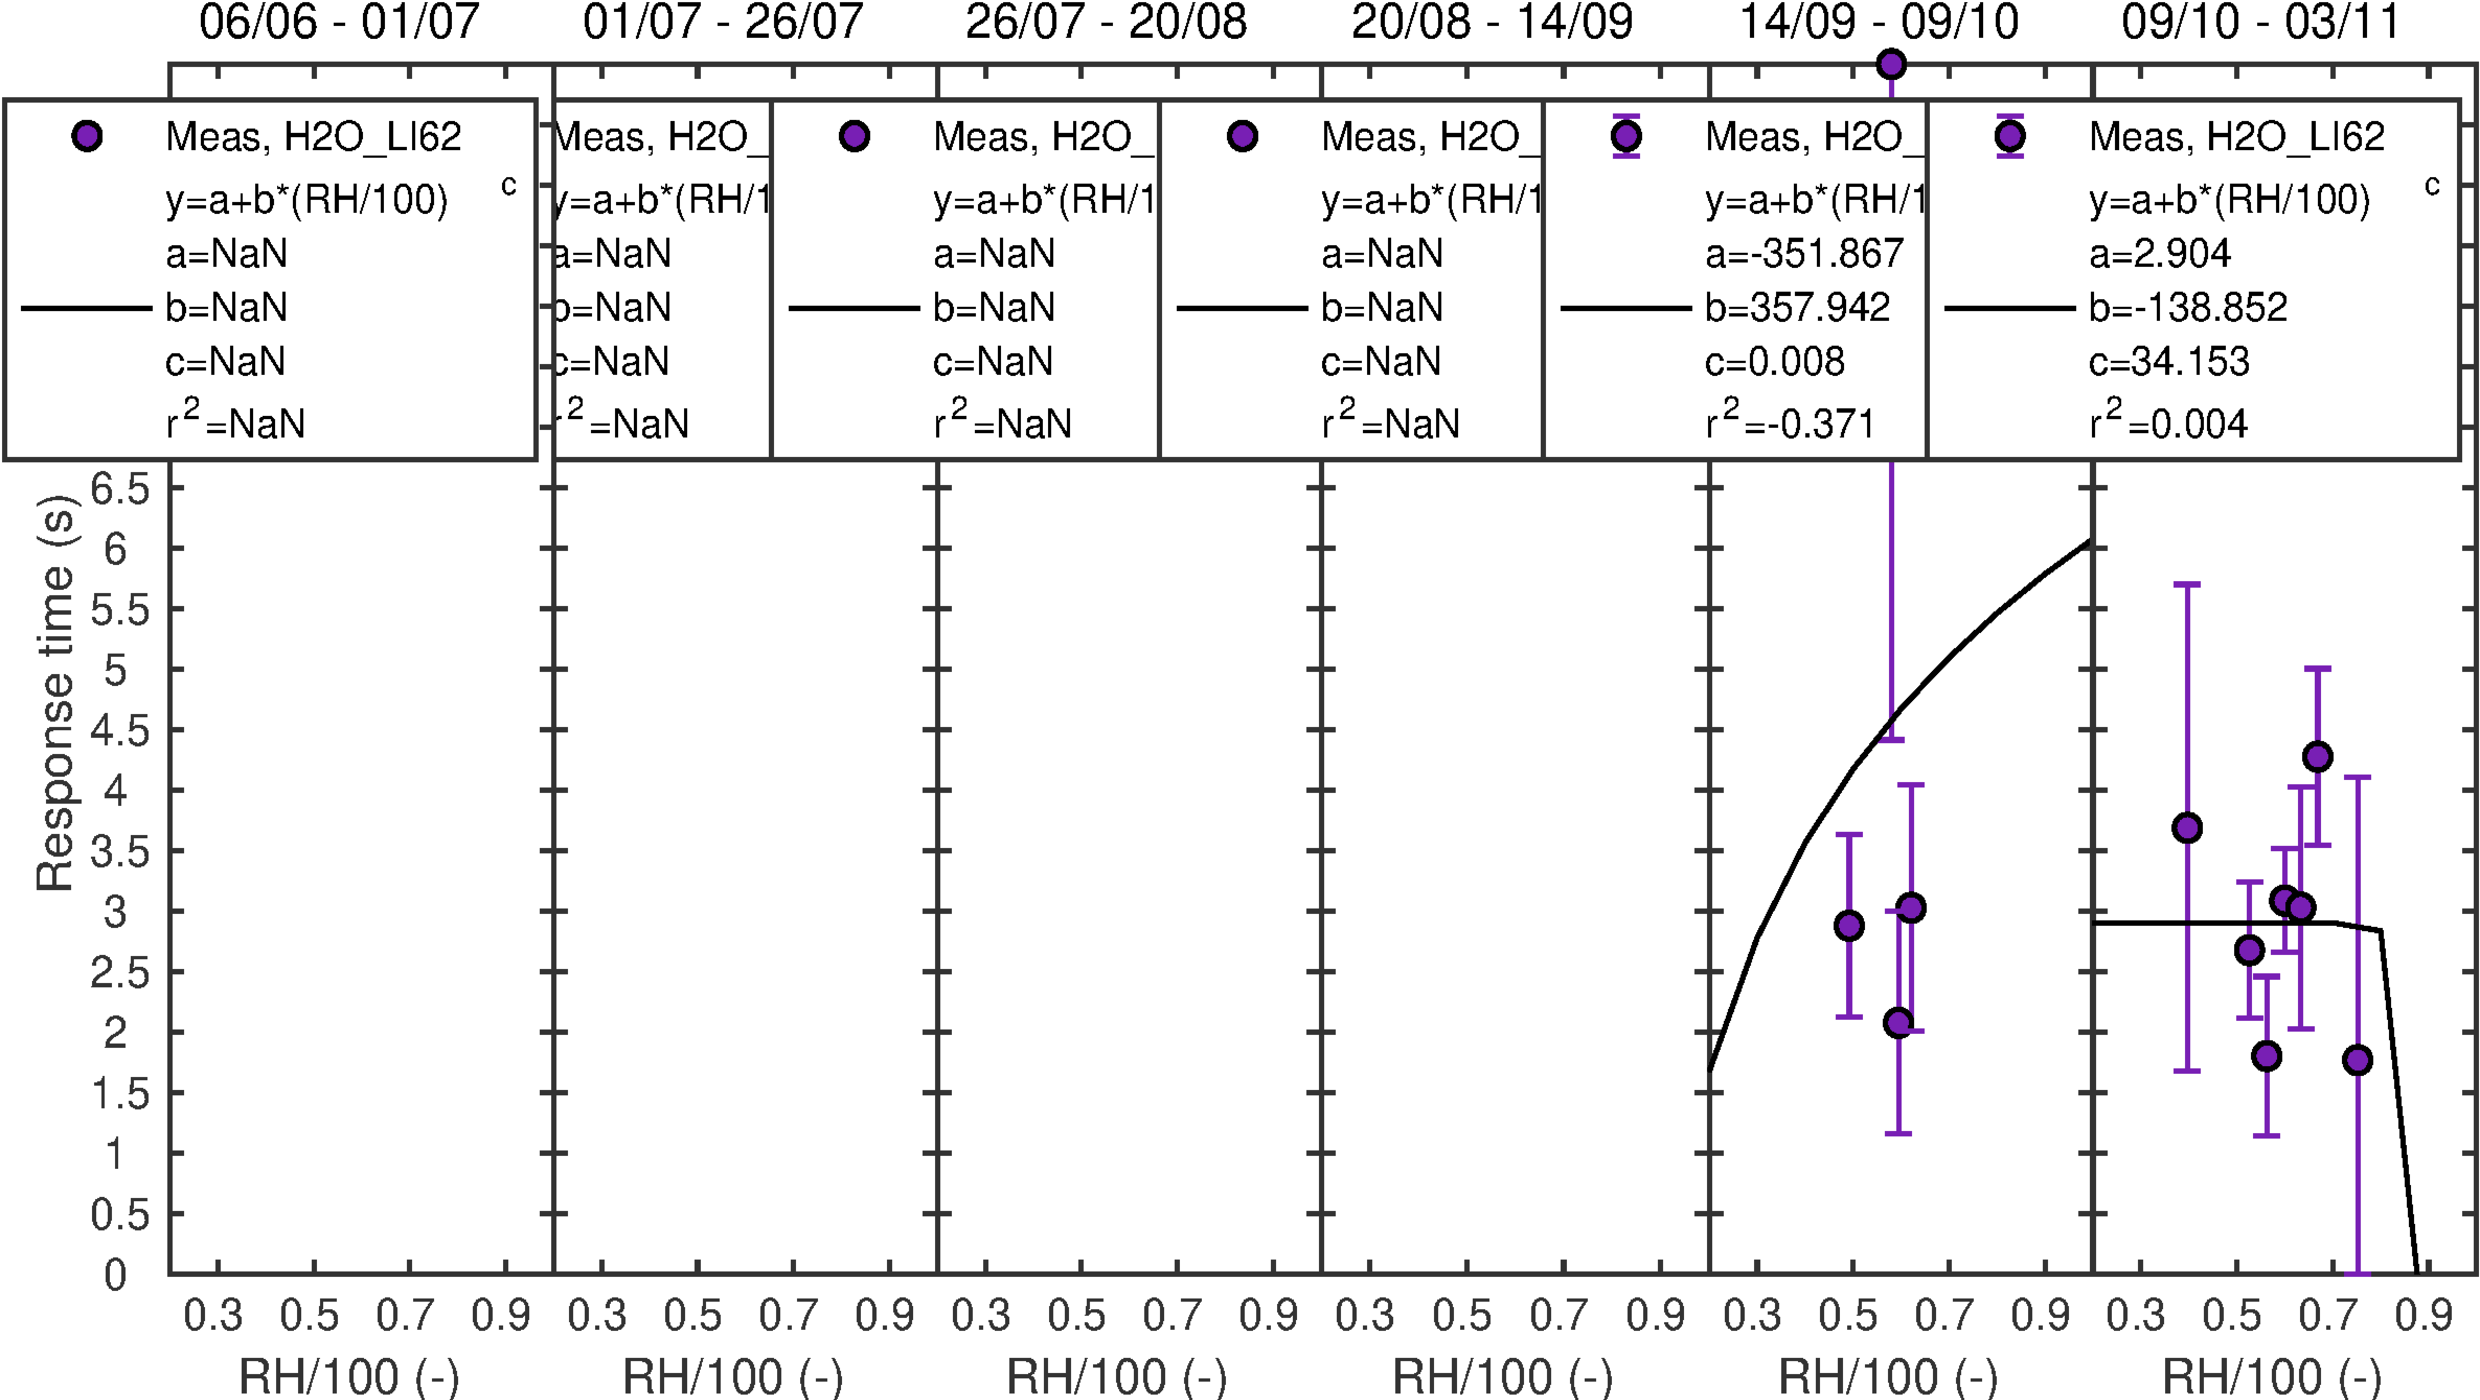
Figure 3: Experimental transfer functions of H2O measurements within 25 day windows and in RH bins (yellow-orange=high RH, blue-green=low RH) and dependence of response times on RH.