

Other EC sites:
Kuivajärvi
SMEAR II subcanopy
SMEAR I (Värriö)
SMEAR II 27.0m
Siikaneva I EC measurements
This website contains plots of data from Siikaneva I EC system.
The figures are intended for detecting instrument's failure and they are updated daily. Data are not quality checked.
You can find the site diary here (the link works only within the University network).
Choose figure category:
Fluxes
Means
Lag times
Spikes
Flow distortion
Spectra/Cospectra
Spectral attenuation
Meteorological/auxiliary data
Mean values from the past 20 days.
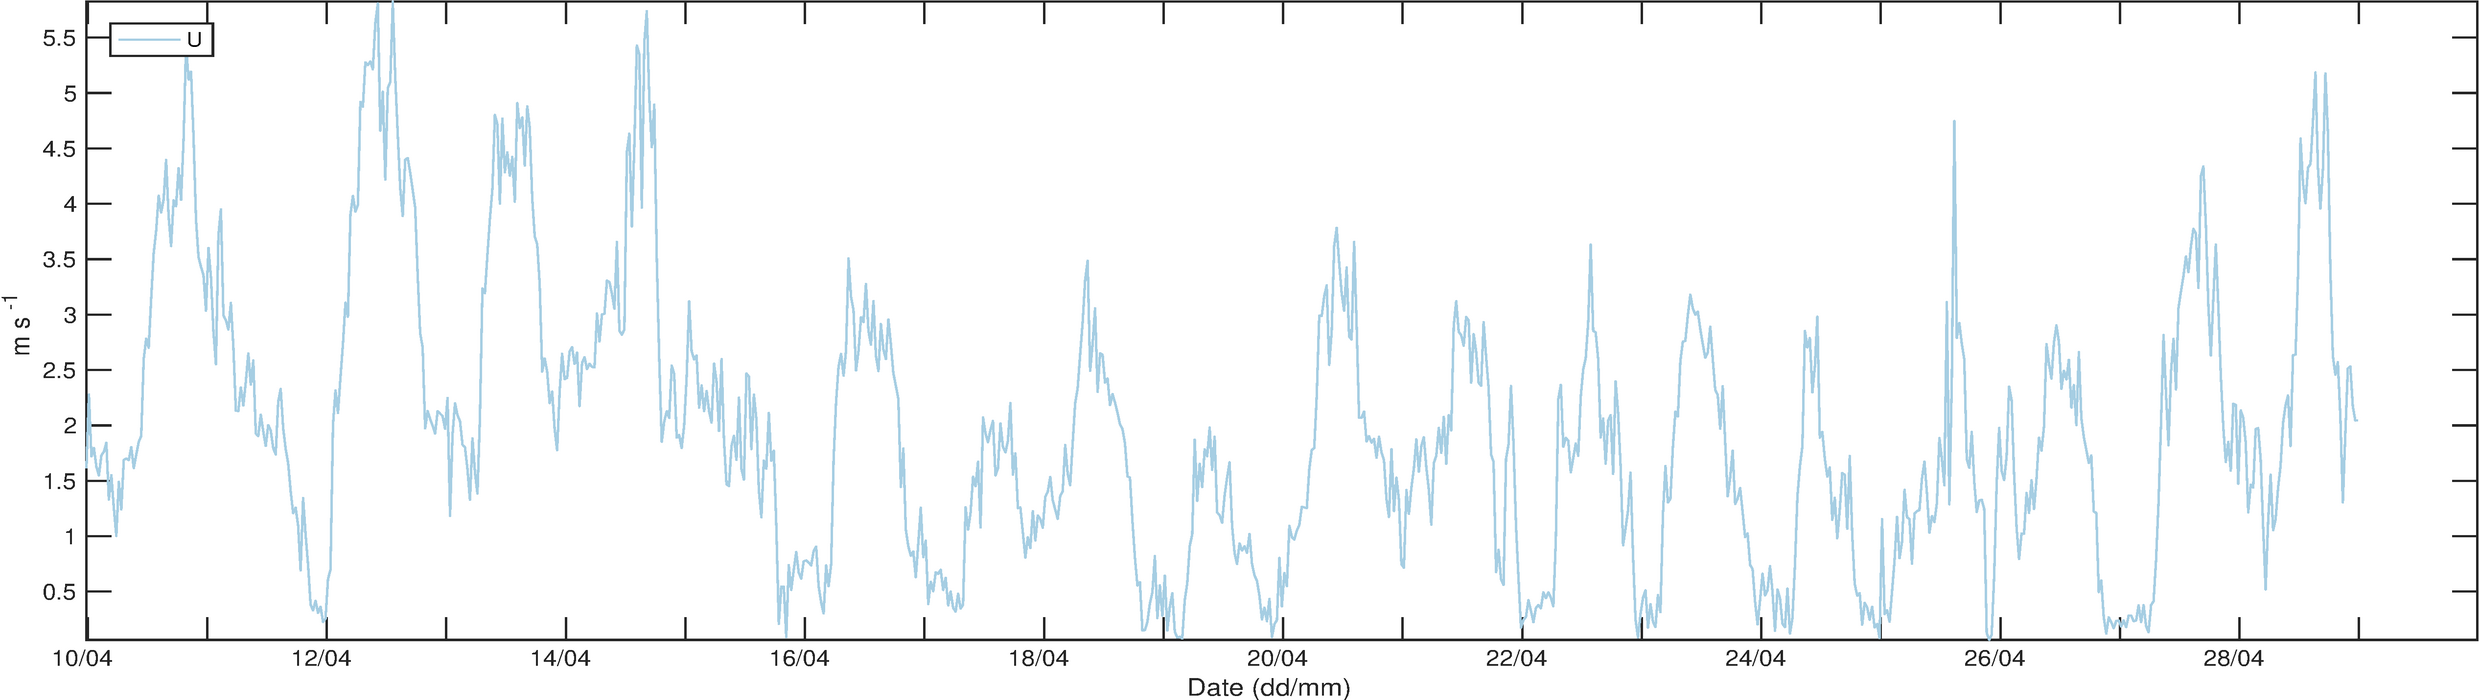
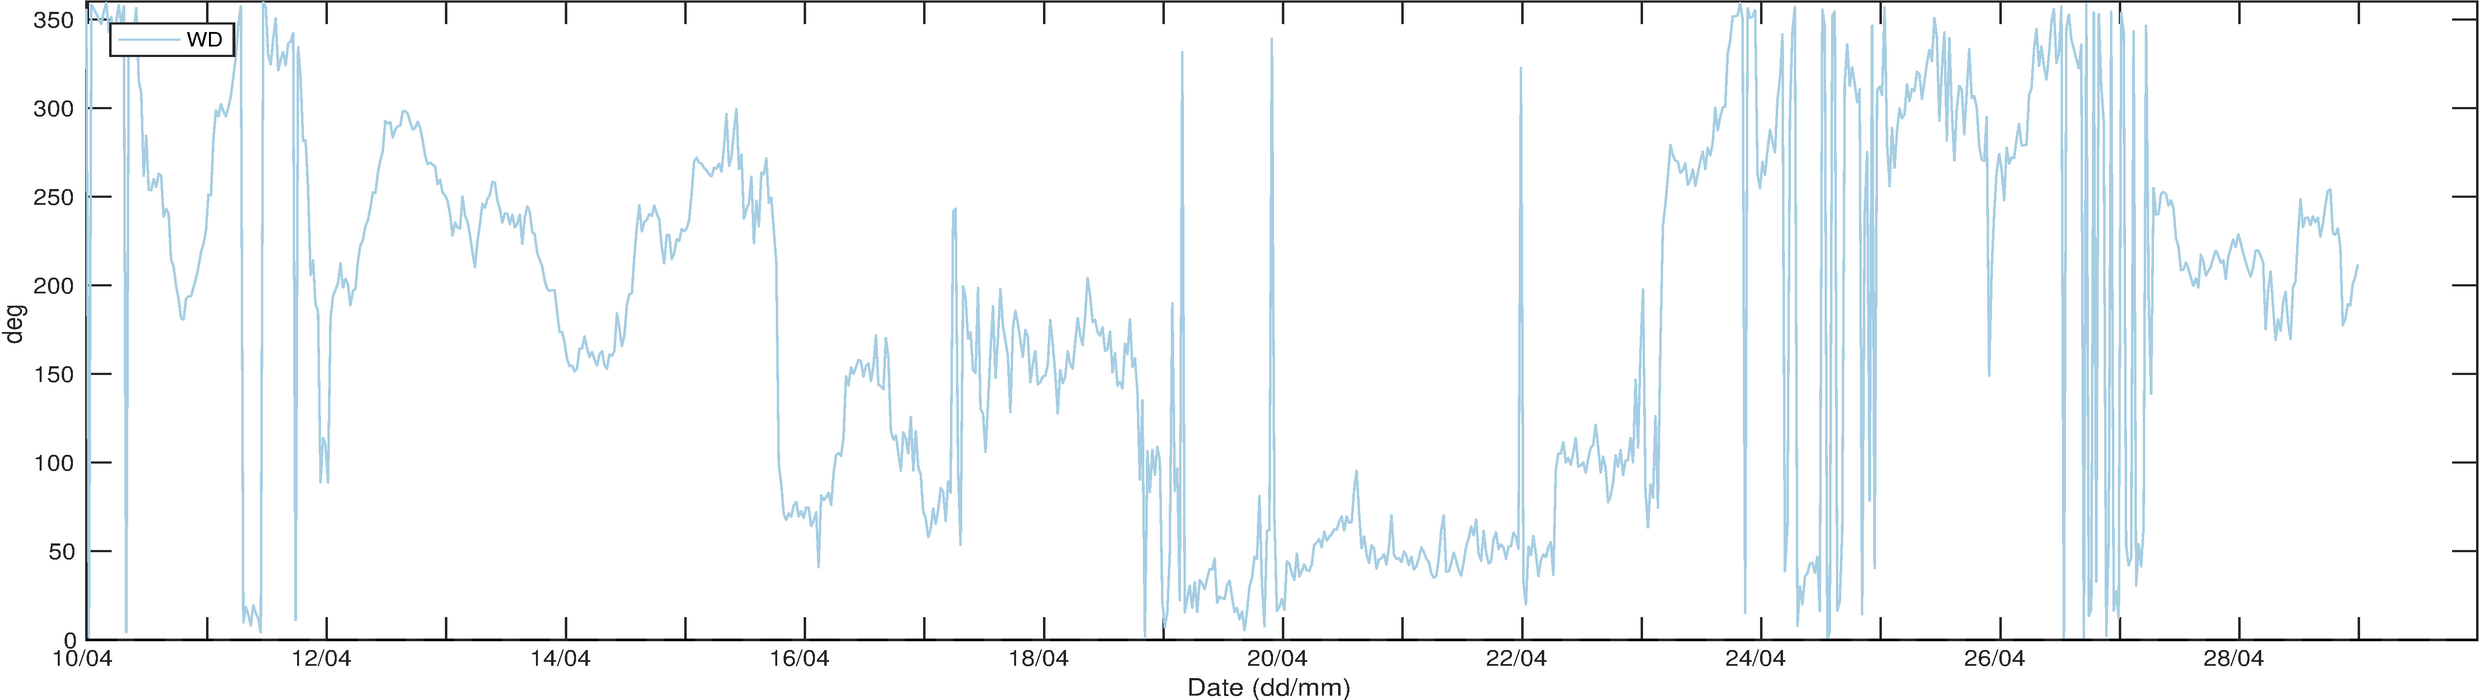
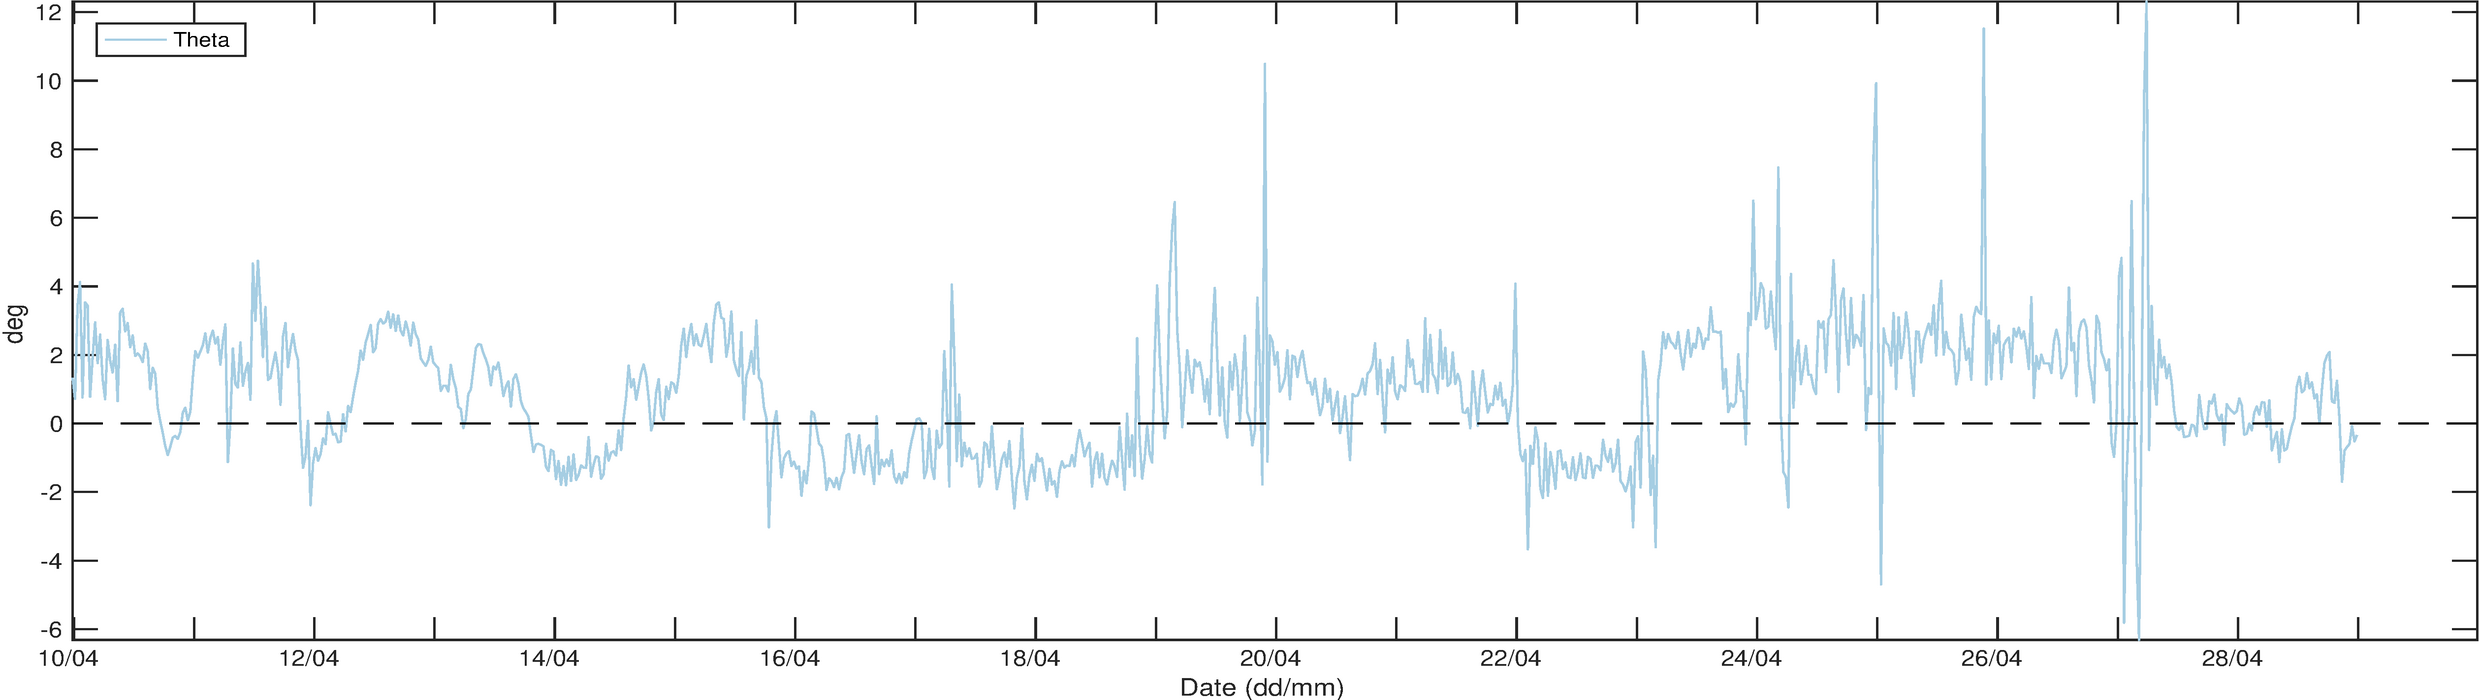
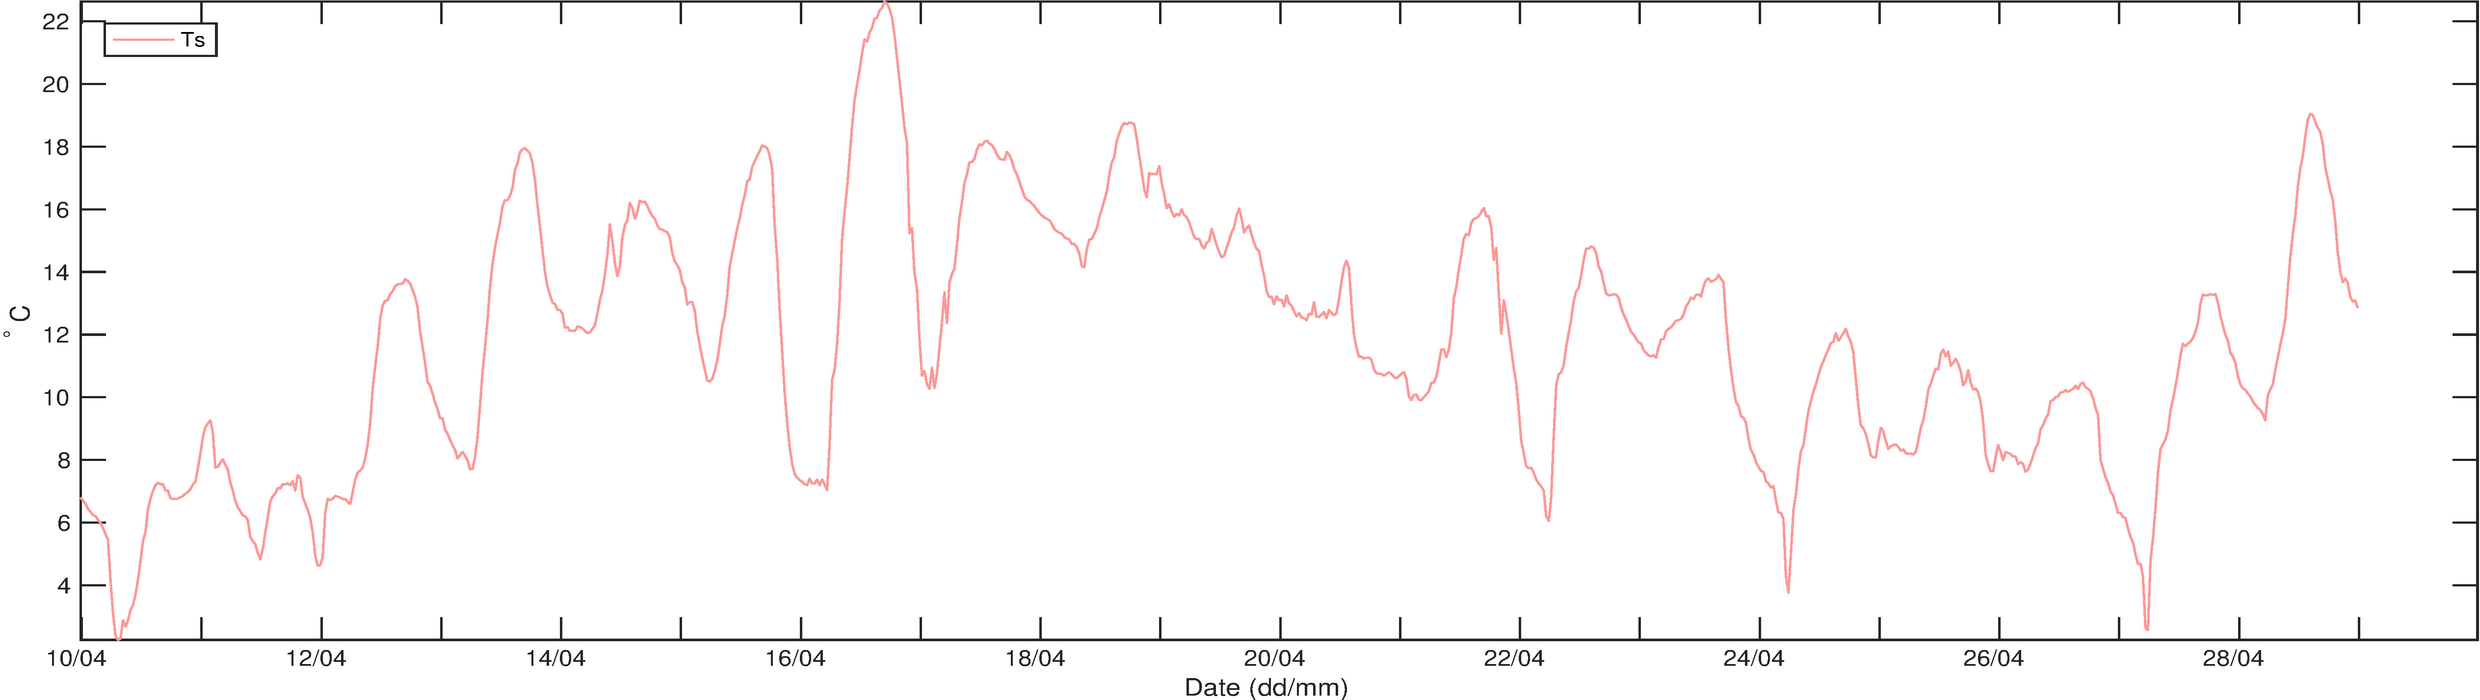
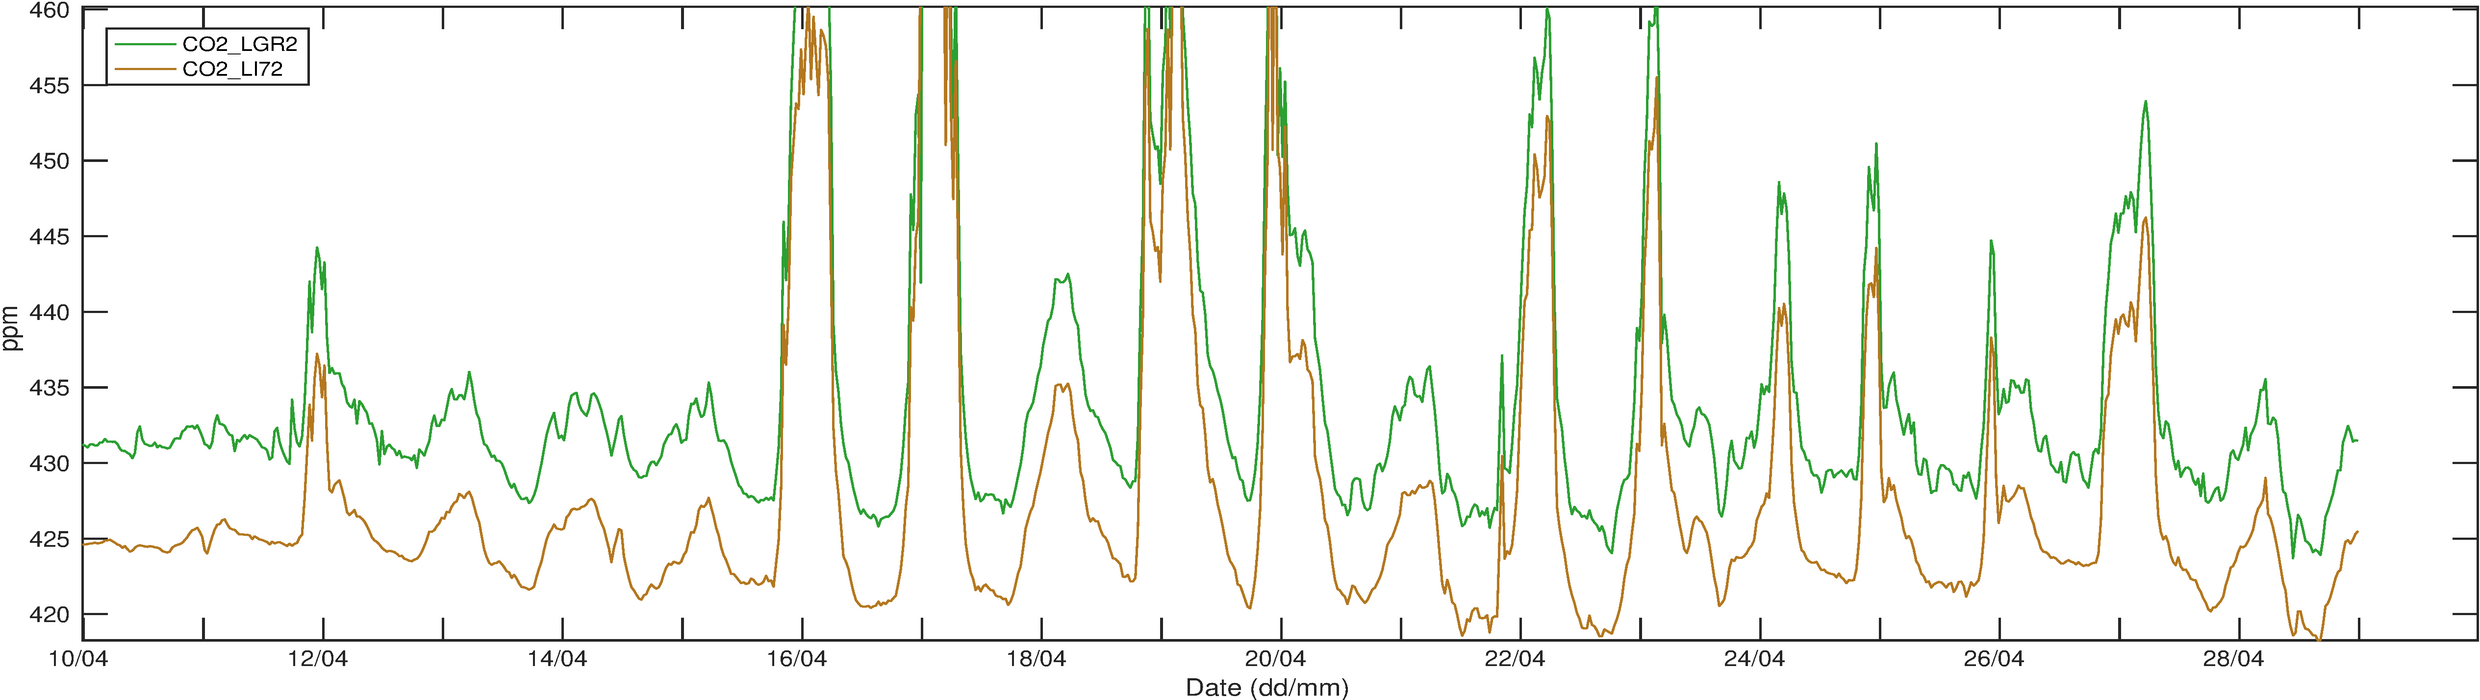
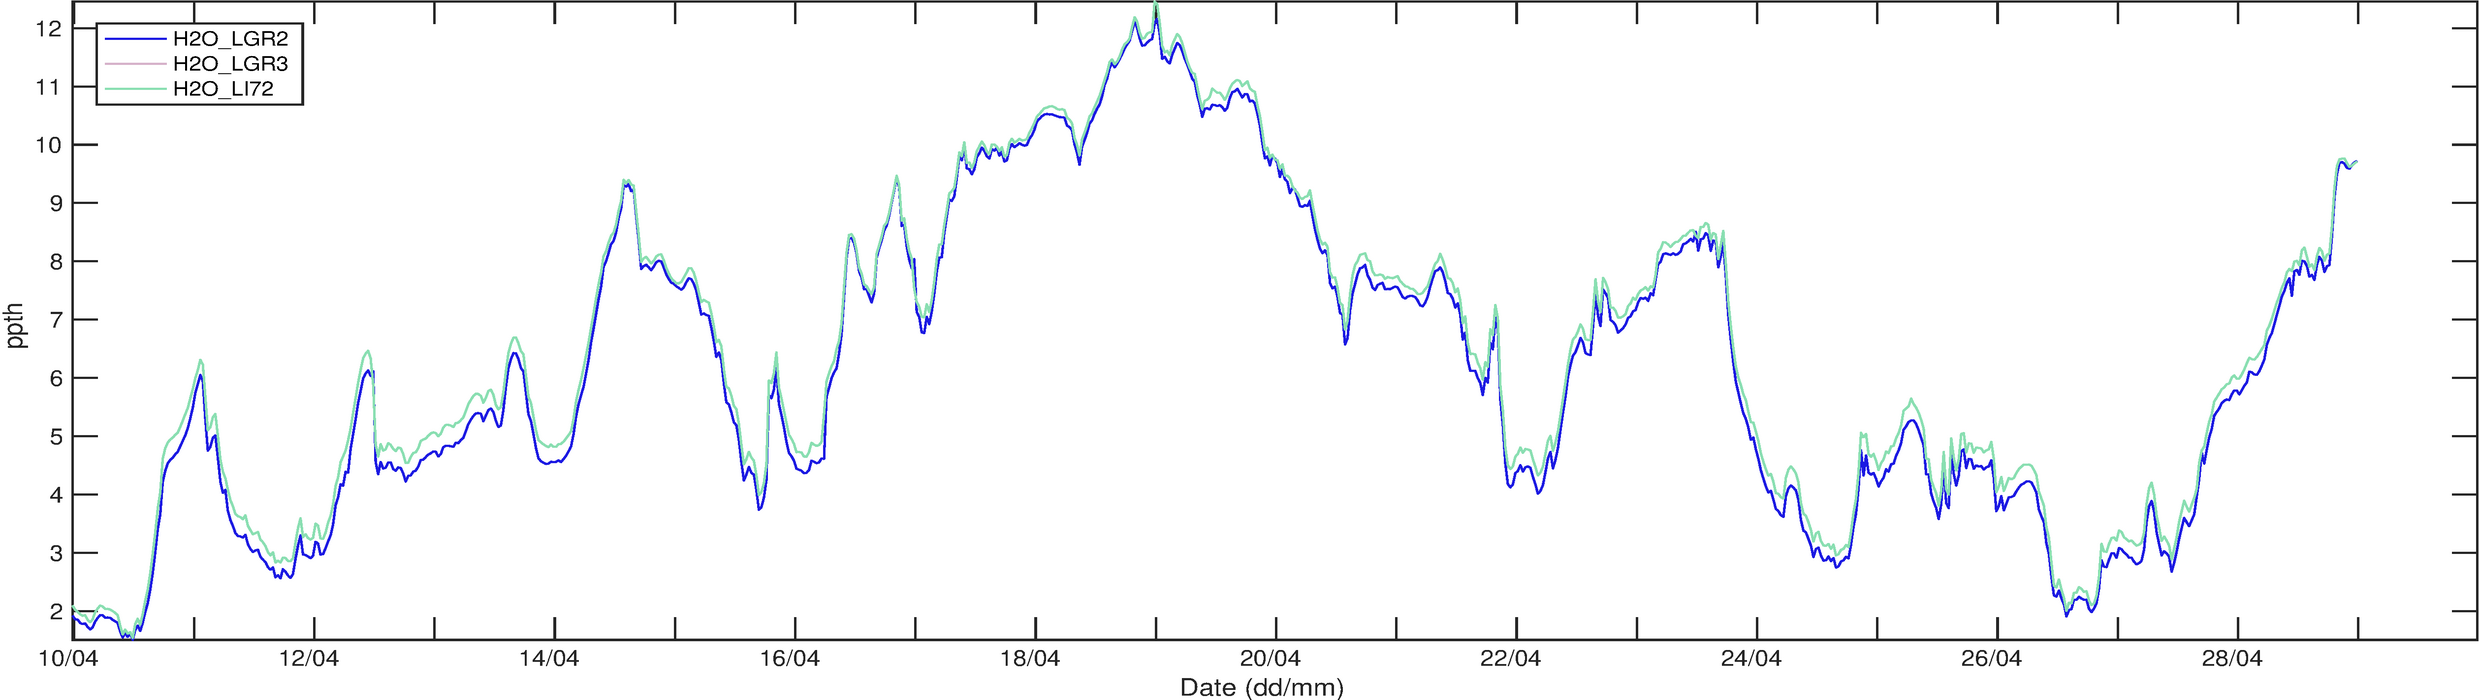
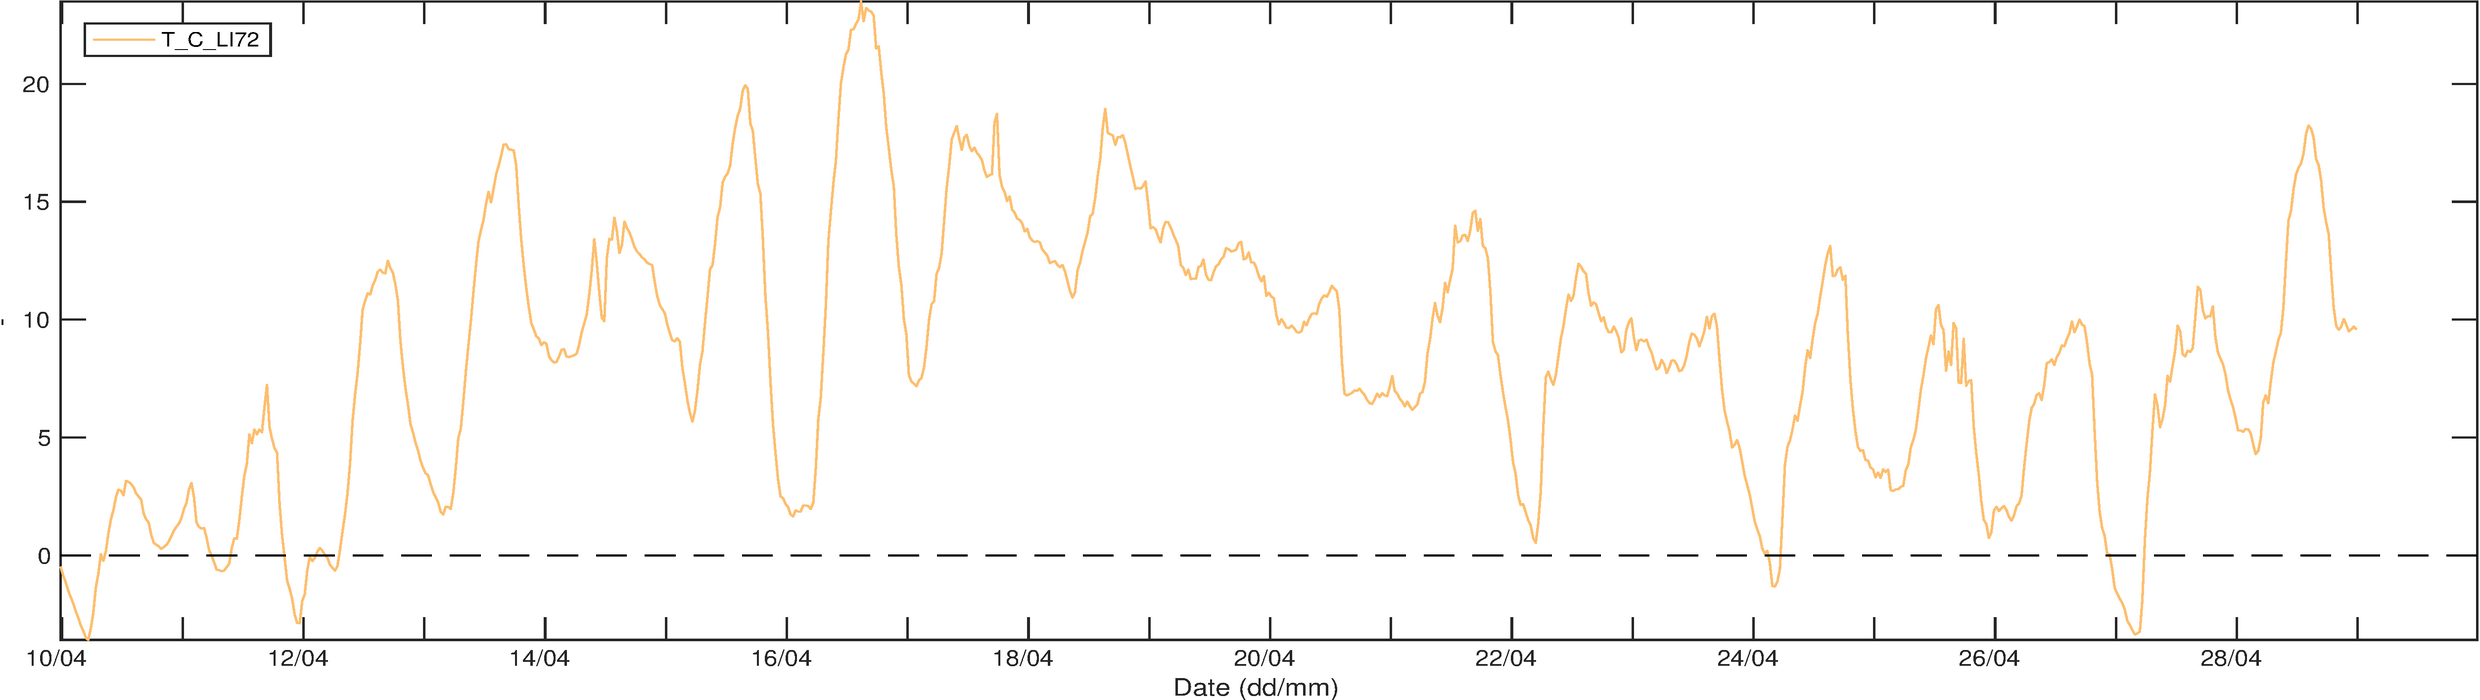
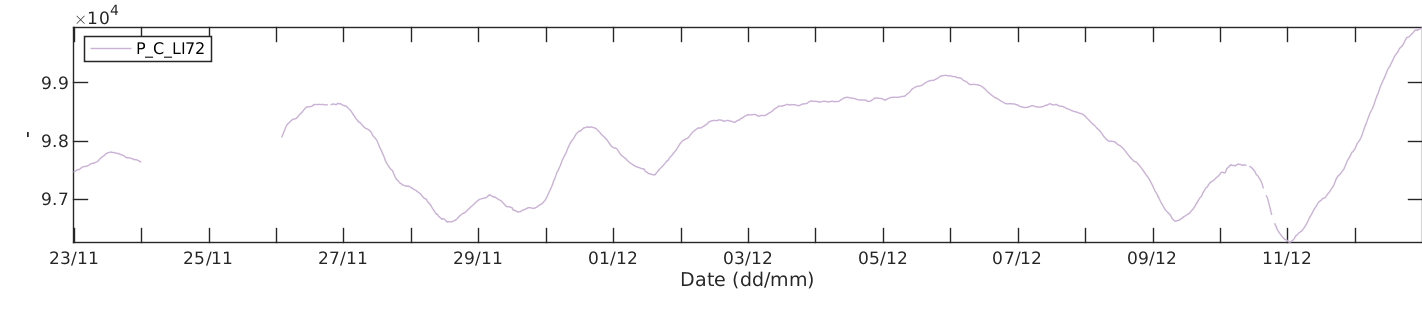
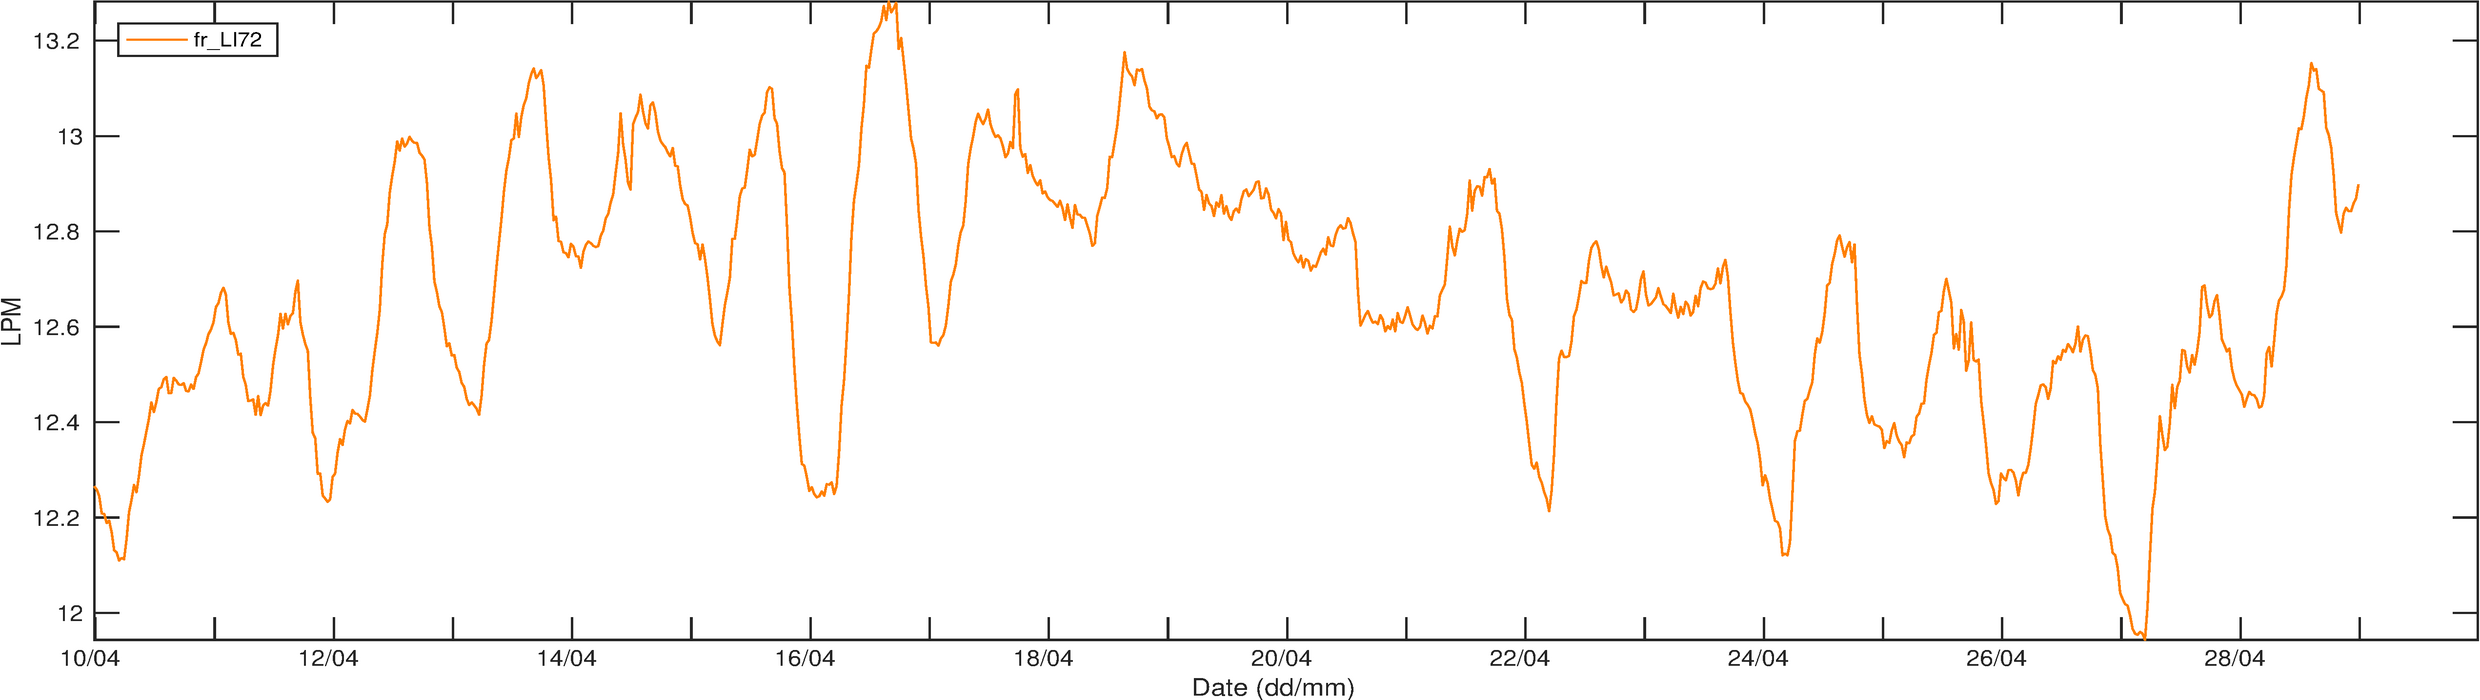
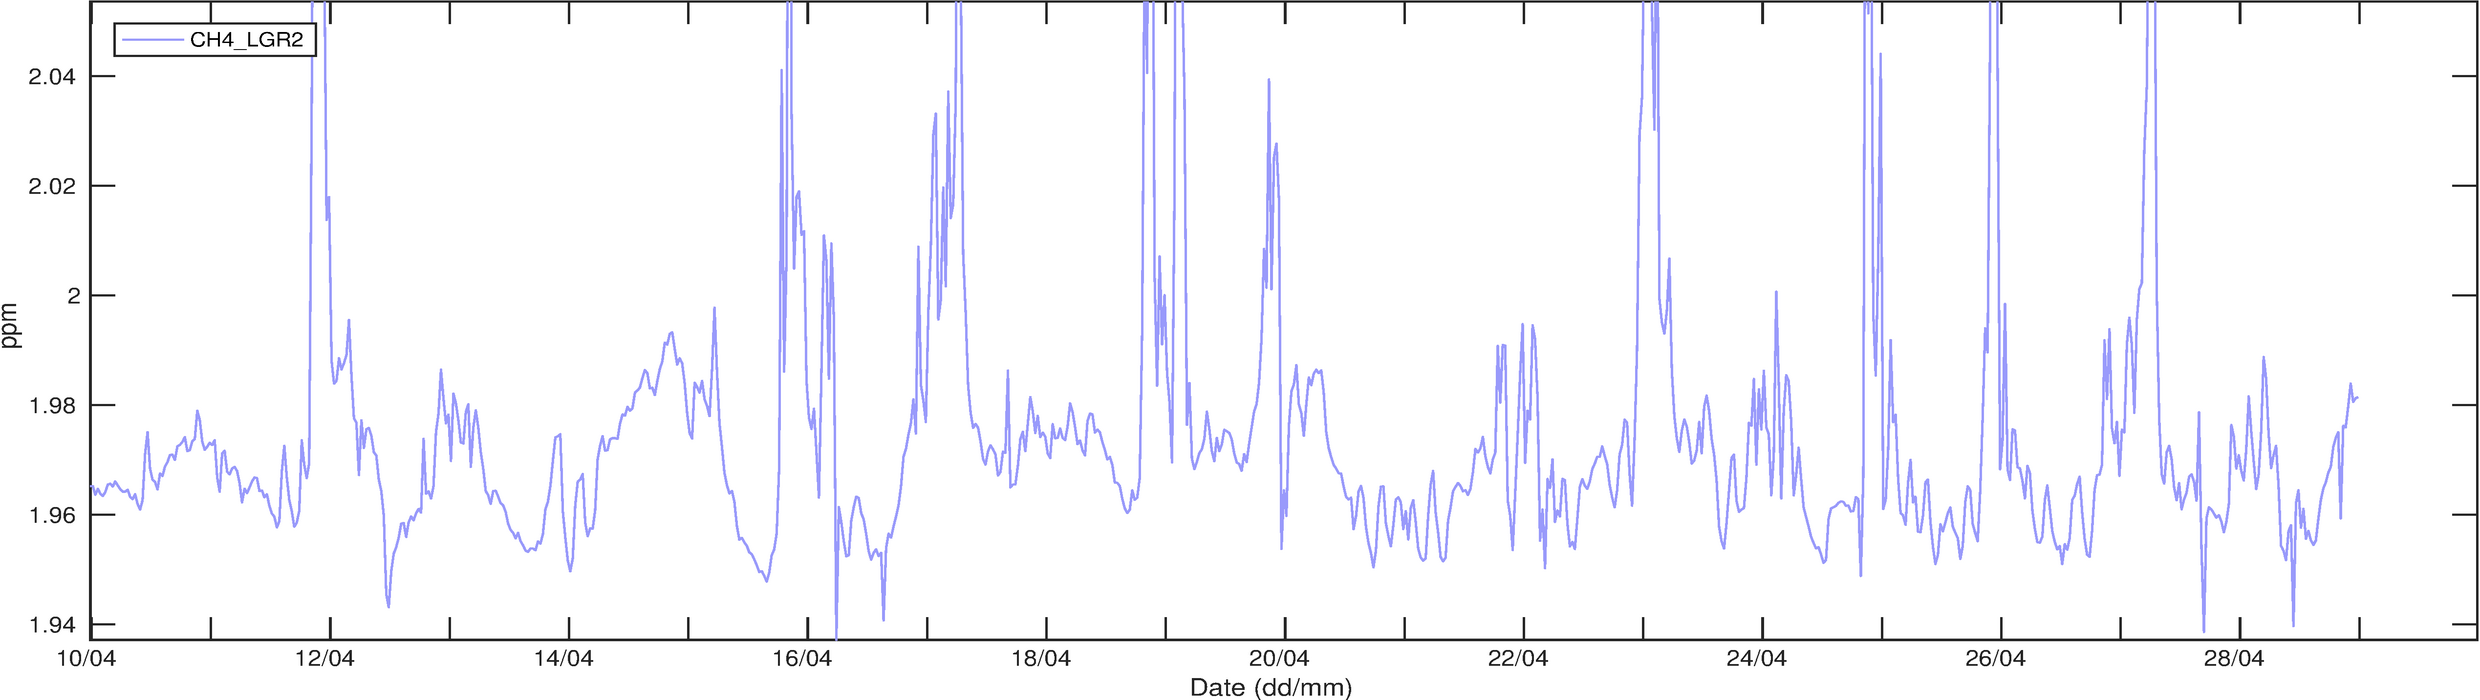
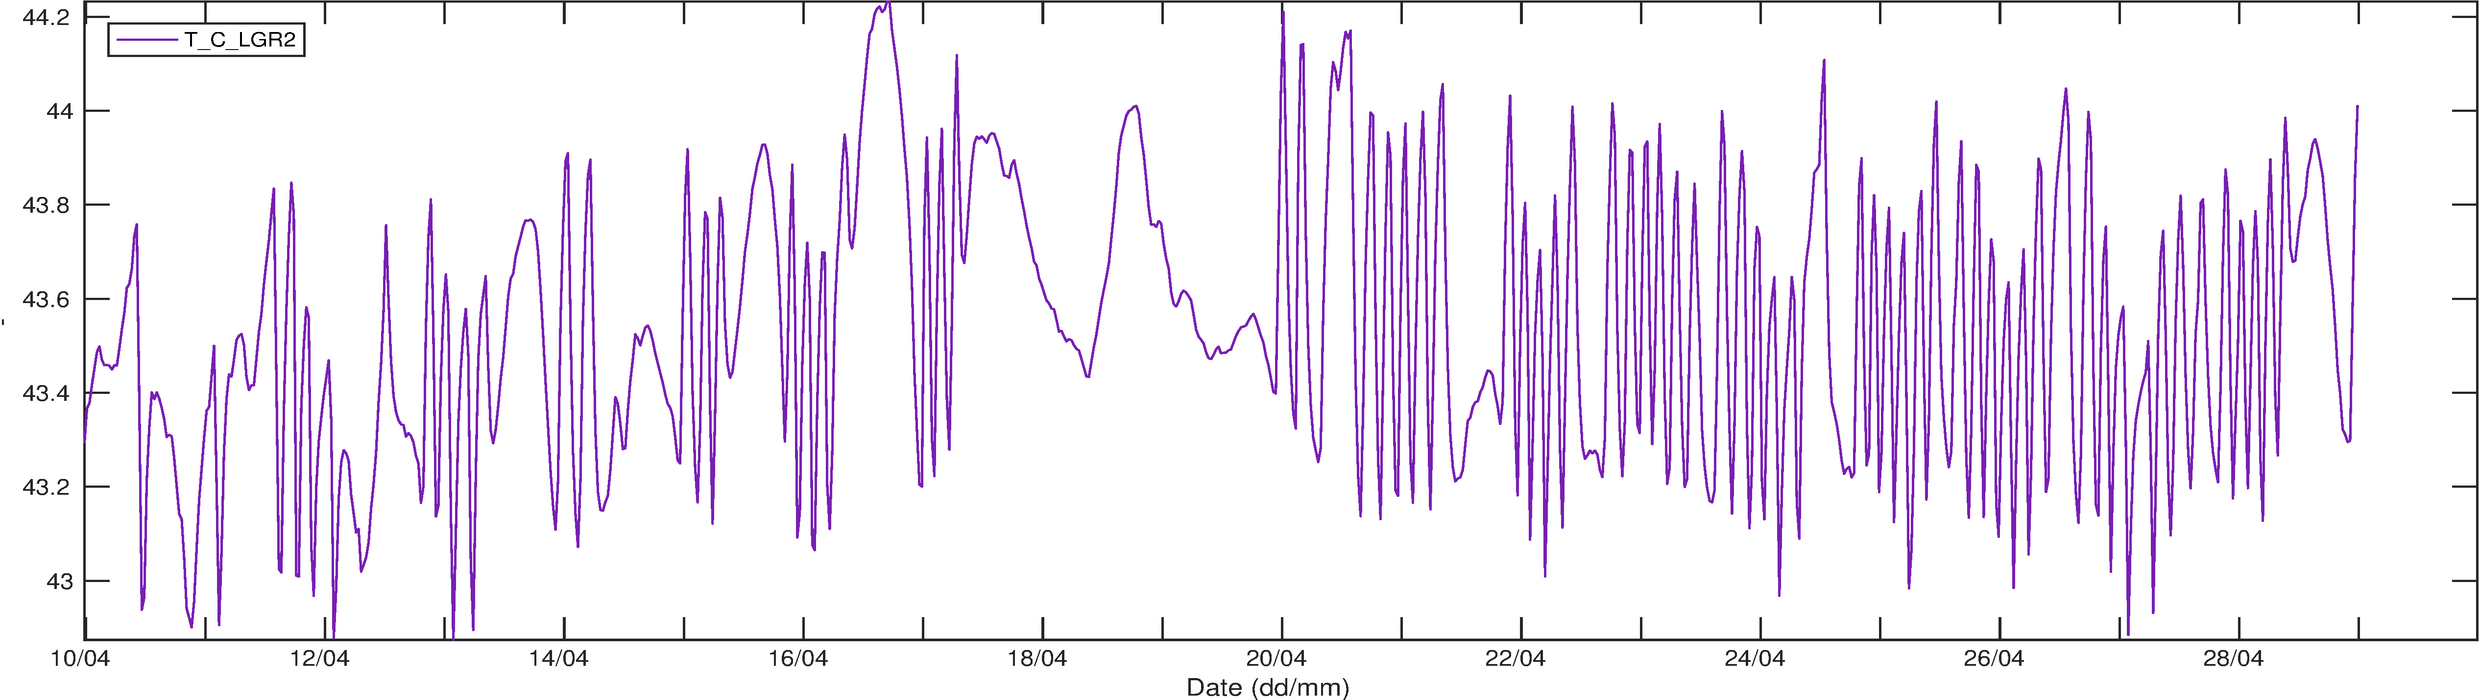
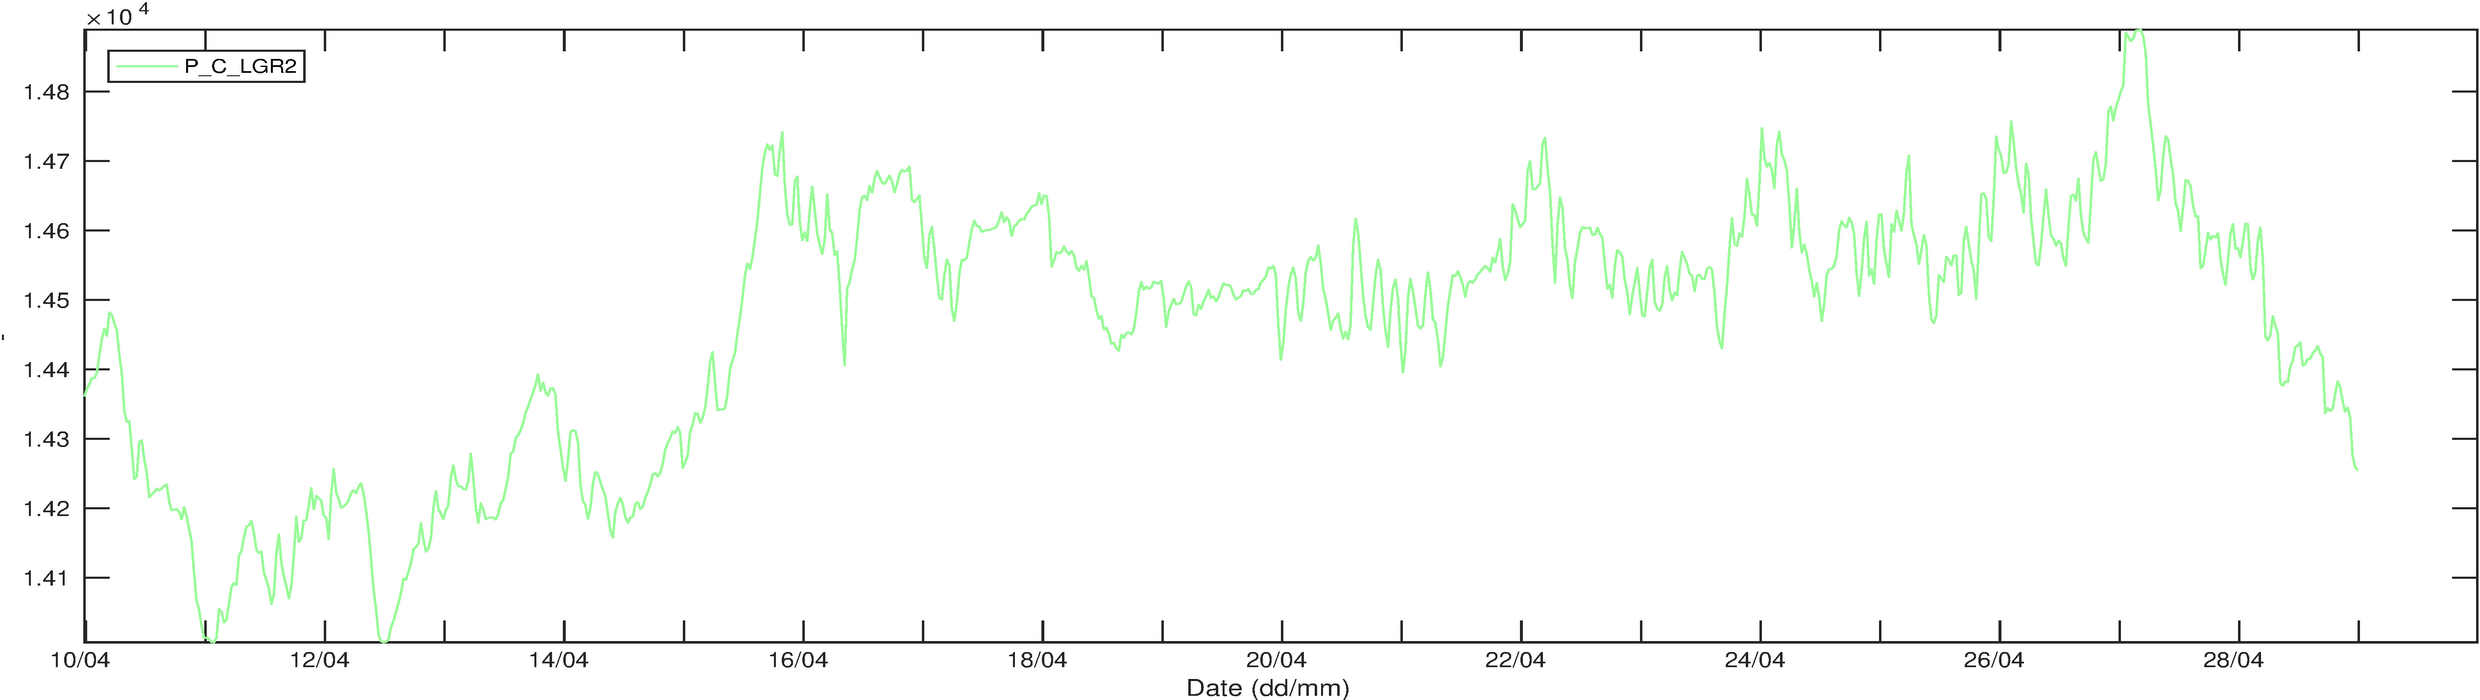
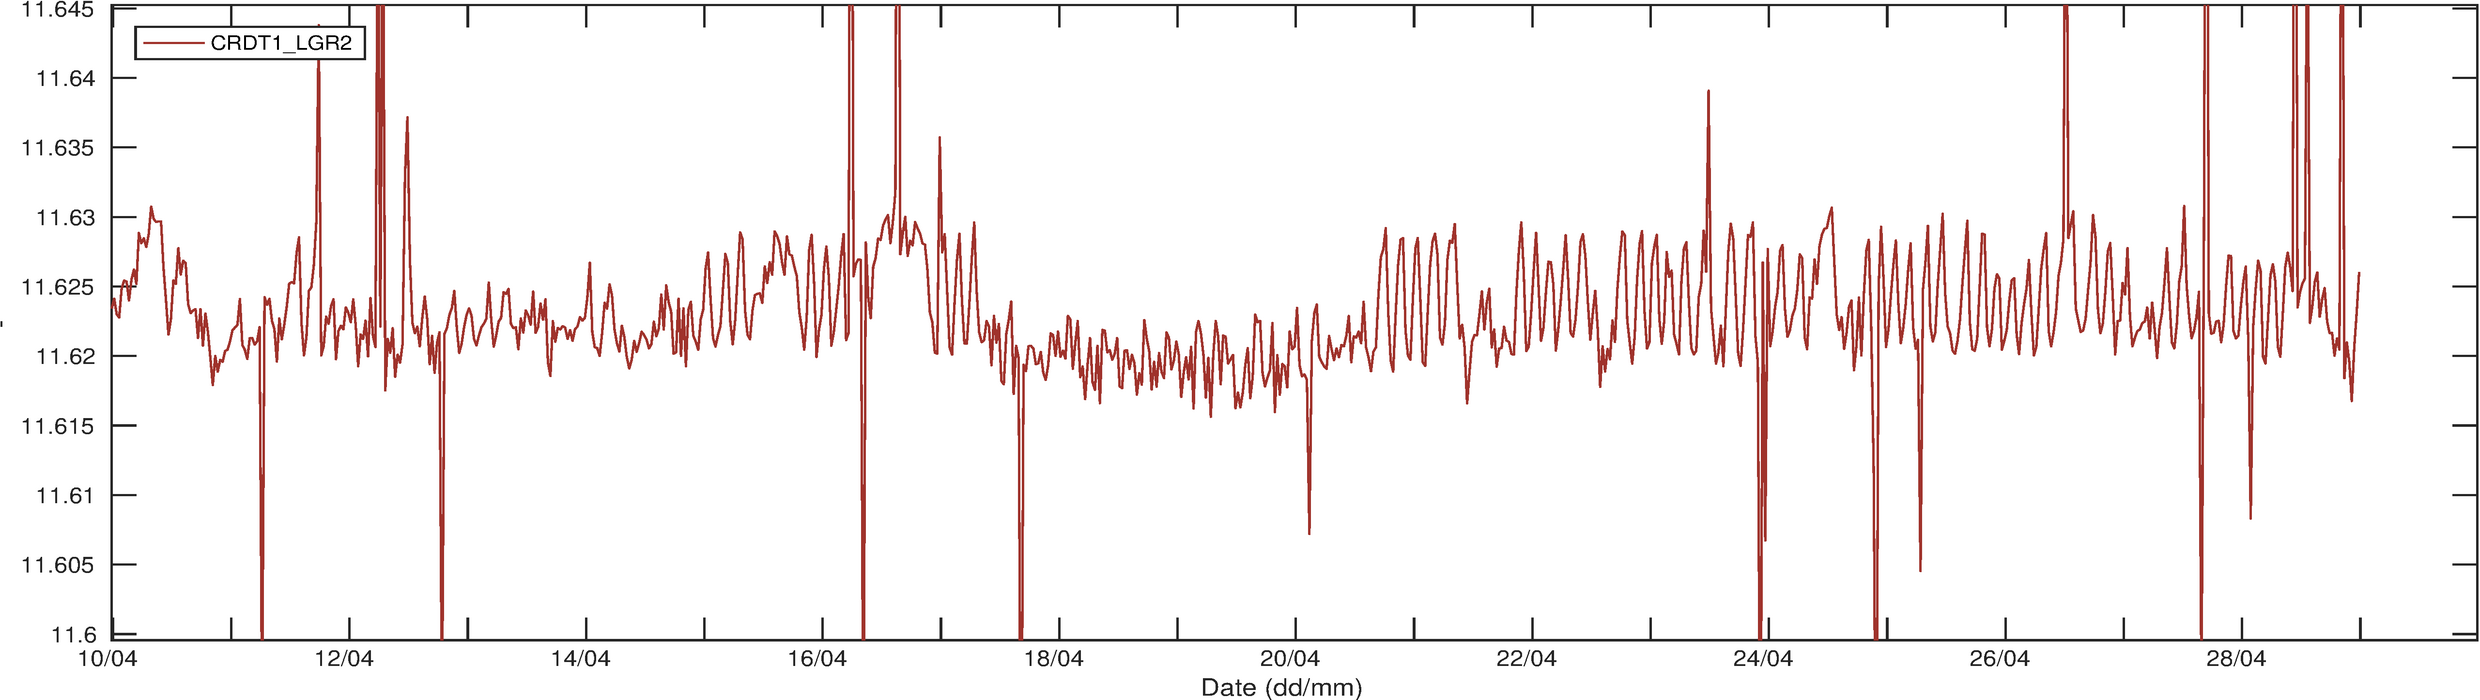
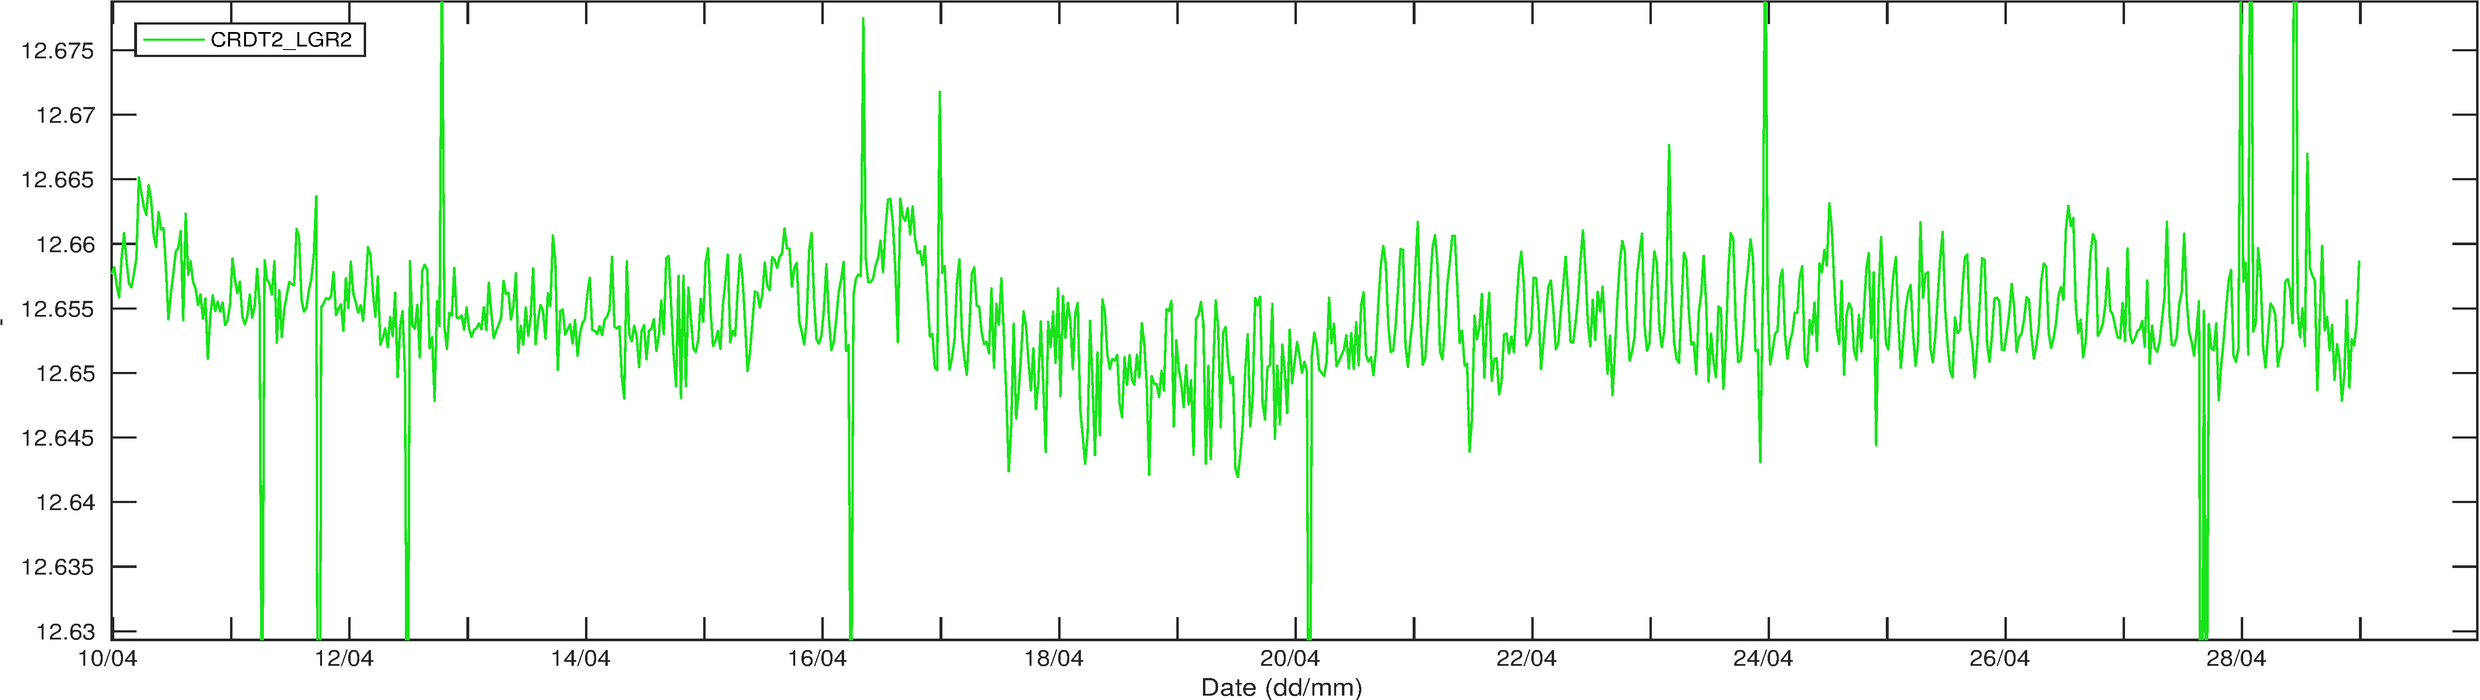
Figure 1: 30 min mean values of different variables during the past 20 days.